

Visualize the PACE-OCI Level-2 CLOUD Products#
Author(s): Chamara Rajapakshe (NASA, SSAI), Andy Sayer (NASA, UMBC), Kirk Knobelspiesse (NASA), Meng Gao (NASA, SSAI), Sean Foley (NASA, MSU)
Last updated: Oct 15, 2026
An Earthdata Login account is required to access data from the NASA Earthdata system, including NASA ocean color data.
Summary#
This notebook summarizes how to access PACE-OCI cloud optical properties (CLOUD) in Level-2 (L2) granules. The CLOUD suite provides cloud optical and microphysical retrievals derived from multi-spectral observations. Note that this notebook is based on an early preliminary version of the product and is therefore subject to future optimizations and changes.
Learning Objectives#
By the end of this notebook, you will understand:
How to acquire PACE-OCI L2 CLOUD data
Available variables in the CLOUD suite
How to visualize cloud properties from PACE-OCI
1. Setup#
Begin by importing all of the packages used in this notebook. If you followed the guidance on the Getting Started page, then the imports will be successful.
import re

import cartopy.crs as ccrs
import earthaccess
import matplotlib.colors as mcolors
import matplotlib.pyplot as plt
import numpy as np
import pandas as pd
import xarray as xr
Global settings and variables used throughout the notebook.
pd.options.display.max_colwidth = None
plt.style.use("seaborn-v0_8-notebook")
plt.rcParams.update(
    {
        "xtick.labelsize": 12,
        "ytick.labelsize": 12,
    }
)
projection = ccrs.PlateCarree()
Define your area and time of interest. Note that the bounding box is supplied as longitudes and latitudes in the order west, south, east, then north.
bbox = (-90, -13, -89, -12)
tspan = ("2025-07-02", "2025-07-02")
Set (and optionally persist to your home directory as a “netrc” file) your Earthdata Login credentials.
auth = earthaccess.login()
Define functions for some repeatable tasks performed in the tutorial.
def print_variable_description(dataset, variables_pattern=None):
    """
    Print a table of variables, units, and descriptions from a dataset.

    Long descriptions are wrapped to 100 characters; only the first line
    prints the variable name and units.

    Parameters
    ----------
    dataset : xarray.Dataset
        Dataset containing variables whose metadata are stored in `attrs`
        (e.g., `units` and `long_name`).
    variables_pattern : str, optional
        Pattern to filter variable names. If None, all variables are shown.

    Returns
    -----
    pandas.DataFrame
        Table describing variables in the dataset
    """
    import pandas as pd

    df = pd.DataFrame(columns=("Units", "Description"))
    for key, value in dataset.data_vars.items():
        if variables_pattern is None or variables_pattern in key:
            units = value.attrs.get("units", "")
            desc = value.attrs.get("long_name", "")
            df.loc[key, :] = [units, desc]
    return df
def extremes_removed_limits(array):
    """
    Return suggested min and max axis limits based on the interquartile range (IQR) rule.

    Parameters
    ----------
    array : array-like
        Input numeric array.

    Returns
    -------
    tuple
        Suggested min and max for axis limits in plots
    """
    q0, q1, q3, q4 = array.quantile([0, 0.25, 0.75, 1])
    vmin = q1 - 1.5 * (q3 - q1)
    vmax = q3 + 1.5 * (q3 - q1)
    return max(q0, vmin), min(q4, vmax)
def geo_axis_tags(ax, crs=None):
    """
    Add coastlines and labeled latitude/longitude gridlines to a Cartopy axis.

    Parameters
    ----------
    ax : cartopy.mpl.geoaxes.GeoAxes
        Axes object on which to draw the gridlines and coastlines.
    crs : cartopy.crs.CRS, optional
        Coordinate reference system used for the gridlines.
        Default is a Plate Carrée projection with central longitude = 0.
    """
    if crs is None:
        crs = ccrs.PlateCarree()
    gl = ax.gridlines(
        crs=crs,
        draw_labels=["left", "bottom"],
        xlabel_style={"size": 12, "color": "k"},
        ylabel_style={"size": 12, "color": "k"},
    )
    ax.coastlines()
    return
def plot_cloud_phase(dataset, name, ax):
    """Plot a map of cloud phase, a categorical variable, on a cartopy GeoAxes

    Parameters
    ----------
    dataset: xarray.Dataset
        The granule with cloud phase variables
    name: str
        The name of a variable with categorical values
    ax : cartopy.mpl.geoaxes.GeoAxes
        Axes object on which to draw the gridlines and coastlines.
    """
    array = dataset[name]
    try:
        flag_values = array.attrs["flag_values"]
        flag_meanings = array.attrs["flag_meanings"].split(" ")
    except KeyError:
        description = array.attrs["long_name"]
        long_name, flags = description.split(": ")
        flag_pairs = re.findall(r"([0-9]) - ([^,]+)", flags)
        flag_values = np.array([int(a) for a, b in flag_pairs], dtype=array.dtype)
        flag_meanings = [b.replace(" ", "_") for a, b in flag_pairs]
    cmap = plt.get_cmap("tab20", flag_values.size)
    cmap.set_bad("grey")
    ctf = array.plot.pcolormesh(
        x="longitude",
        y="latitude",
        cmap=cmap,
        vmin=flag_values.min() - 0.5,
        vmax=flag_values.max() + 0.5,
        add_colorbar=False,
    )
    cbar = ax.figure.colorbar(ctf, ax=ax, orientation="vertical")
    cbar.set_ticks(flag_values)
    cbar.set_ticklabels(flag_meanings)
    ax.gridlines(draw_labels=["left", "bottom"])
    ax.coastlines()
    ax.set_title(name)
2. Get Level-2 Data#
Search Earthdata collections with earthaccess.search_datasets to find likely candidates, based on a free-text search for “clouds”, among the L2 products from the PACE-OCI instrument.
results = earthaccess.search_datasets(
    keyword="clouds",
    platform="PACE",
    instrument="OCI",
    processing_level_id="2",
)
for item in results:
    title = item["umm"]["EntryTitle"].replace("PACE OCI Level-2 Regional", "")
    print(f'{item.summary["short-name"]}: {title}')
PACE_OCI_L2_CLOUD_MASK:   Cloud Mask Data, version 3.1
PACE_OCI_L2_CLOUD:   Cloud Optical Properties Data, version 3.1
PACE_OCI_L2_CLOUD_MASK_NRT:   Cloud Mask - Near Real-time (NRT) Data, version 3.1
PACE_OCI_L2_CLOUD_NRT:   Cloud Optical Properties - Near Real-time (NRT) Data, version 3.1
PACE_OCI_L2_AOP:   Apparent Optical Properties Data, version 3.2
PACE_OCI_L2_SFREFL:   Surface Reflectance Data, version 3.1
PACE_OCI_L2_AOP_NRT:   Apparent Optical Properties - Near Real-time (NRT) Data, version 3.2
PACE_OCI_L2_LANDVI:   Land Vegetation Indices Data, version 3.1
PACE_OCI_L2_SFREFL_NRT:   Surface Reflectance - Near Real-time (NRT) Data, version 3.1
PACE_OCI_L2_LANDVI_NRT:   Land Vegetation Indices - Near Real-time (NRT) Data, version 3.1
You can use the short name PACE_OCI_L2_CLOUD to get the most recent version available for the CLOUD product at Level-2 for the PACE-OCI instrument. Add the Near Real Time (NRT) suffix for the most recent observations (i.e. PACE_OCI_L2_CLOUD_NRT).
Search for available granules within a time range and geospatial area of interest. The sort_key parameter can help when multiple versions are available; the -revision_date key will show the most recent versions first.
results = earthaccess.search_data(
    short_name="PACE_OCI_L2_CLOUD",
    temporal=tspan,
    bounding_box=bbox,
    sort_key="-revision_date",
)
for item in results:
    display(item)

paths = earthaccess.open(results)
Extract the science variables from groups within the granule into an xarray.Dataset for convenience in data manipulations.
datatree = xr.open_datatree(paths[0])
dataset = datatree["geophysical_data"].to_dataset()
for item in ("latitude", "longitude"):
    dataset.coords[item] = datatree["navigation_data"][item]
dataset
<xarray.Dataset> Size: 278MB
Dimensions:           (number_of_lines: 1709, pixels_per_line: 1272)
Coordinates:
    latitude          (number_of_lines, pixels_per_line) float32 9MB ...
    longitude         (number_of_lines, pixels_per_line) float32 9MB ...
Dimensions without coordinates: number_of_lines, pixels_per_line
Data variables: (12/29)
    cer_22            (number_of_lines, pixels_per_line) float32 9MB ...
    cot_22            (number_of_lines, pixels_per_line) float32 9MB ...
    cwp_22            (number_of_lines, pixels_per_line) float32 9MB ...
    cer_21            (number_of_lines, pixels_per_line) float32 9MB ...
    cot_21            (number_of_lines, pixels_per_line) float32 9MB ...
    cwp_21            (number_of_lines, pixels_per_line) float32 9MB ...
    ...                ...
    cth_dctp          (number_of_lines, pixels_per_line) float32 9MB ...
    cth_dctt          (number_of_lines, pixels_per_line) float32 9MB ...
    cth_dalb          (number_of_lines, pixels_per_line) float32 9MB ...
    ice_cloud         (number_of_lines, pixels_per_line) float32 9MB ...
    water_cloud       (number_of_lines, pixels_per_line) float32 9MB ...
l2_flags (number_of_lines, pixels_per_line) int32 9MB ...3. Understanding PACE-OCI L2 CLOUD Variables#
PACE-OCI CLOUD products provide various cloud optical and microphysical properties. The product structure includes multiple variables with descriptive metadata. Given the early stage of the product, improvements and changes are expected in future versions.
We’ll use our own print_variable_description function to inspect the dataset.
help(print_variable_description)
Help on function print_variable_description in module __main__:

print_variable_description(dataset, variables_pattern=None)
    Print a table of variables, units, and descriptions from a dataset.

    Long descriptions are wrapped to 100 characters; only the first line
    prints the variable name and units.

    Parameters
    ----------
    dataset : xarray.Dataset
        Dataset containing variables whose metadata are stored in `attrs`
        (e.g., `units` and `long_name`).
    variables_pattern : str, optional
        Pattern to filter variable names. If None, all variables are shown.

    Returns
    -----
    pandas.DataFrame
        Table describing variables in the dataset
Cloud Optical Properties#
Cloud optical thickness and effective radius are fundamental properties retrieved from multi-spectral observations.
print_variable_description(dataset, "cot")
| Units | Description | |
|---|---|---|
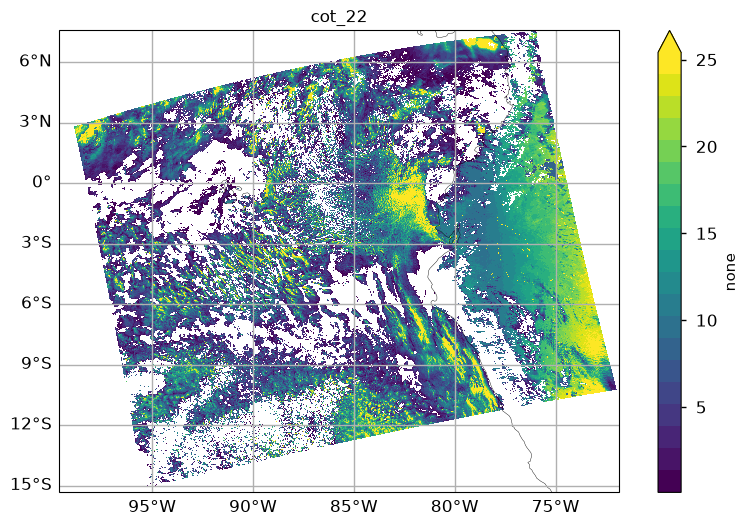
| cot_22 | none | Cloud Optical Thickness at 670 nm two-channel retrieval using the 1.6 um band and either the 0.65 um, 0.86 um, or 1.2 um band (specified in cld_non_abs_band) |
| cot_21 | none | Cloud Optical Thickness at 670 nm two-channel retrieval using the 1.6 um band and either the 0.65 um, 0.86 um, or 1.2 um band (specified in cld_non_abs_band) |
| cot_16 | none | Cloud Optical Thickness at 670 nm two-channel retrieval using the 1.6 um band and either the 0.65 um, 0.86 um, or 1.2 um band (specified in cld_non_abs_band) |
| cth_cot | Cloud optical thickness at 760 nm from cloud top height algorithm" | |
| cth_dcot | Estimated 1-sigma uncertainty on retrieved COT at 760 nm from cloud top height algorithm |
print_variable_description(dataset, "cer")
| Units | Description | |
|---|---|---|
| cer_22 | micron | Cloud Particle Effective Radius two-channel retrieval using the 2.2 um band and either the 0.65 um, 0.86 um, or 1.2 um band (specified in cld_non_abs_band) |
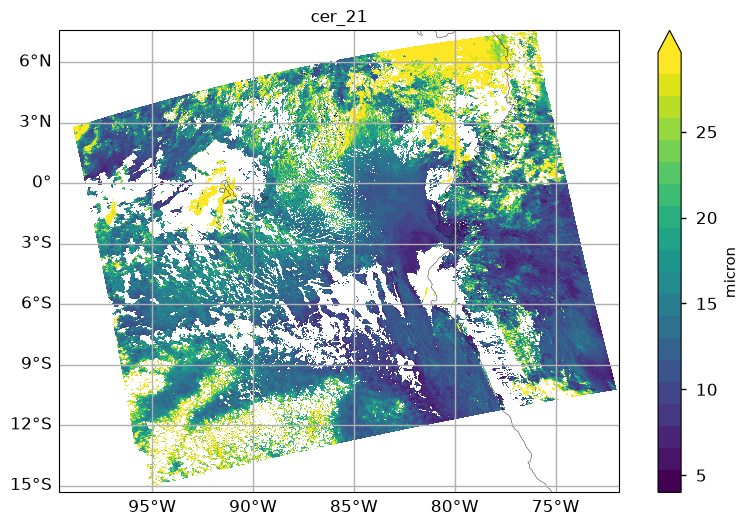
| cer_21 | micron | Cloud Particle Effective Radius two-channel retrieval using the 2.1 um band and either the 0.65 um, 0.86 um, or 1.2 um band (specified in cld_non_abs_band) |
| cer_16 | micron | Cloud Particle Effective Radius two-channel retrieval using the 1.6 um band and either the 0.65 um, 0.86 um, or 1.2 um band (specified in cld_non_abs_band) |
Cloud Phase and Other Properties#
Additional variables include cloud phase information and other cloud properties.
print_variable_description(dataset)
| Units | Description | |
|---|---|---|
| cer_22 | micron | Cloud Particle Effective Radius two-channel retrieval using the 2.2 um band and either the 0.65 um, 0.86 um, or 1.2 um band (specified in cld_non_abs_band) |
| cot_22 | none | Cloud Optical Thickness at 670 nm two-channel retrieval using the 1.6 um band and either the 0.65 um, 0.86 um, or 1.2 um band (specified in cld_non_abs_band) |
| cwp_22 | g/m^2 | Cloud Column Water Path two-channel retrieval using the 2.2 um band and either the 0.65 um, 0.86 um, or 1.2 um band (specified in cld_non_abs_band) |
| cer_21 | micron | Cloud Particle Effective Radius two-channel retrieval using the 2.1 um band and either the 0.65 um, 0.86 um, or 1.2 um band (specified in cld_non_abs_band) |
| cot_21 | none | Cloud Optical Thickness at 670 nm two-channel retrieval using the 1.6 um band and either the 0.65 um, 0.86 um, or 1.2 um band (specified in cld_non_abs_band) |
| cwp_21 | g/m^2 | Cloud Column Water Path two-channel retrieval using the 2.1 um band and either the 0.65 um, 0.86 um, or 1.2 um band (specified in cld_non_abs_band) |
| cer_16 | micron | Cloud Particle Effective Radius two-channel retrieval using the 1.6 um band and either the 0.65 um, 0.86 um, or 1.2 um band (specified in cld_non_abs_band) |
| cot_16 | none | Cloud Optical Thickness at 670 nm two-channel retrieval using the 1.6 um band and either the 0.65 um, 0.86 um, or 1.2 um band (specified in cld_non_abs_band) |
| cwp_16 | g/m^2 | Cloud Column Water Path two-channel retrieval using the 1.6 um band and either the 0.65 um, 0.86 um, or 1.2 um band (specified in cld_non_abs_band) |
| ctp | mbar | Air pressure at the cloud top |
| ctt | degree K | Air temperature at the cloud top |
| cth | kilometers | Height at the cloud top |
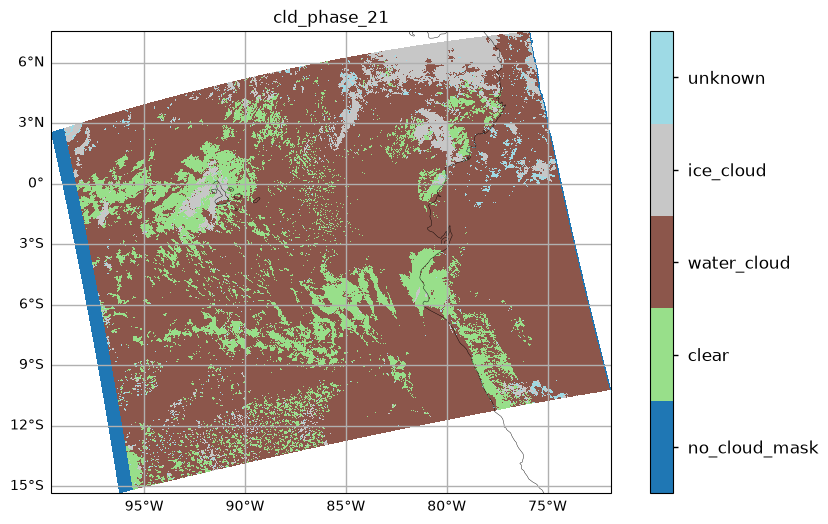
| cld_phase_21 | Index of the cloud phase derived for the 2100 nm products: 0 - no cloud mask, 1 - clear, 2 - water cloud, 3 - ice cloud, 4 - unknown, assume water cloud | |
| cld_phase_22 | Index of the cloud phase derived for the 2200 nm products: 0 - no cloud mask, 1 - clear, 2 - water cloud, 3 - ice cloud, 4 - unknown, assume water cloud | |
| cld_phase_16 | Index of the cloud phase derived for the 1600 nm products: 0 - no cloud mask, 1 - clear, 2 - water cloud, 3 - ice cloud, 4 - unknown, assume water cloud | |
| cld_non_abs_band | Non-absorbing band used for 2-channel cloud retrieval: 0 - none, 1 - around 650 nm (for land surface), 2 = around 860 (for water surface), 3 - around 1200 (ice/snow surface) | |
| cth_phase | none | Cloud phase determined by cloud top height algorithm: 0 - water, 1 - ice |
| cth_cot | Cloud optical thickness at 760 nm from cloud top height algorithm" | |
| cth_cost | Retrieval cost at solution for best-fit cloud optical model | |
| cth_iter | Number of iterations to convergence for best-fit cloud optical model | |
| cth_alb | Best surface albedo made by cloud top height algorithm | |
| cth_dcot | Estimated 1-sigma uncertainty on retrieved COT at 760 nm from cloud top height algorithm | |
| cth_dcth | kilometers | Estimated 1sigma uncertainty on retrieved CTH for best-fit cloud optical model, km |
| cth_dctp | kilometers | Estimated 1sigma uncertainty on retrieved CTP for best-fit cloud optical model, mb |
| cth_dctt | degree K | Estimated 1sigma uncertainty on retrieved CTT for best-fit cloud optical model, K |
| cth_dalb | Estimated 1sigma uncertainty on retrieved surface albedo for best-fit cloud optical model | |
| ice_cloud | Ice cloud fraction for this pixel: 0 - none, 1 - cloud | |
| water_cloud | Water cloud fraction for this pixel: 0 - none, 1 - cloud | |
| l2_flags | Level-2 Processing Flags |
4. Visualizing Variables#
To visualize the L2 variables, we plot them on cartopy GeoAxes dressed up with our geo_axis_tags function with the color range limited by our extremes_removed_limits function.
help(geo_axis_tags)
Help on function geo_axis_tags in module __main__:

geo_axis_tags(ax, crs=None)
    Add coastlines and labeled latitude/longitude gridlines to a Cartopy axis.

    Parameters
    ----------
    ax : cartopy.mpl.geoaxes.GeoAxes
        Axes object on which to draw the gridlines and coastlines.
    crs : cartopy.crs.CRS, optional
        Coordinate reference system used for the gridlines.
        Default is a Plate Carrée projection with central longitude = 0.
help(extremes_removed_limits)
Help on function extremes_removed_limits in module __main__:

extremes_removed_limits(array)
    Return suggested min and max axis limits based on the interquartile range (IQR) rule.

    Parameters
    ----------
    array : array-like
        Input numeric array.

    Returns
    -------
    tuple
        Suggested min and max for axis limits in plots
Cloud Effective Radius#
Visualize the cloud effective radius retrieved from OCI observations. The colorbar limits are adjusted based on the range of observed effective radii, excluding extreme values.
fig, ax = plt.subplots(figsize=(10, 6), subplot_kw={"projection": projection})
var = "cer_21"
array = dataset[var]
vmin, vmax = extremes_removed_limits(array)
cmap = plt.get_cmap("viridis", 20)
img = array.plot.pcolormesh(
    x="longitude",
    y="latitude",
    cmap=cmap,
    vmin=vmin,
    vmax=vmax,
)
img.colorbar.set_label(array.attrs.get("units", ""))
ax.set_title(var, size=12)
geo_axis_tags(ax, projection)
plt.show()
Cloud Optical Thickness#
Cloud optical thickness provides information about the opacity of clouds to solar radiation.
fig, ax = plt.subplots(figsize=(10, 6), subplot_kw={"projection": projection})
var = "cot_22"
array = dataset[var]
vmin, vmax = extremes_removed_limits(array)
cmap = plt.get_cmap("viridis", 20)
img = array.plot.pcolormesh(
    x="longitude",
    y="latitude",
    cmap=cmap,
    vmin=vmin,
    vmax=vmax,
)
img.colorbar.set_label(array.attrs.get("units", ""))
ax.set_title(var, size=12)
geo_axis_tags(ax, projection)
plt.show()
Cloud Phase#
Cloud phase classification distinguishes between liquid and ice clouds. These variables are discrete, also known as categorical, which we visualize with our plot_cloud_phase function.
help(plot_cloud_phase)
Help on function plot_cloud_phase in module __main__:

plot_cloud_phase(dataset, name, ax)
    Plot a map of cloud phase, a categorical variable, on a cartopy GeoAxes

    Parameters
    ----------
    dataset: xarray.Dataset
        The granule with cloud phase variables
    name: str
        The name of a variable with categorical values
    ax : cartopy.mpl.geoaxes.GeoAxes
        Axes object on which to draw the gridlines and coastlines.
fig, ax = plt.subplots(figsize=(10, 6), subplot_kw={"projection": projection})
plot_cloud_phase(dataset, "cld_phase_21", ax)
plt.show()
5. Reference#
Platnick, S., Meyer, K., King, M. D., Wind, G., Amarasinghe, N., Marchant, B., Arnold, G. T., Zhang, Z., Hubanks, P. A., Ridgway, B., & Riedi, J. (2017). The MODIS Cloud Optical and Microphysical Products: Collection 6 Updates and Examples From Terra and Aqua. IEEE Transactions on Geoscience and Remote Sensing, 55(1), 502–525. https://doi.org/10.1109/TGRS.2016.2610522
Sayer, A. M., Cairns, B., Knobelspiesse, K. D., Lelli, L., Rajapakshe, C., Giangrande, S. E., Thomas, G. E., and Zhang, D.: Evaluation of cloud height, optical thickness, and phase retrievals from the CHROMA algorithm applied to Sentinel-3 OLCI data, Atmos. Meas. Tech., 18, 6681–6703, https://doi.org/10.5194/amt-18-6681-2025, 2025.
You have completed the notebook on OCI cloud products. May we suggest studying the notebook on HARP2 cloud products?