

Visualize SPEXone L2 V4.0 aerosol product (FastMAPOL)#
Authors: Meng Gao (NASA/SSAI), Sean Foley (NASA/MSU), Kamal Aryal (NASA/UMBC)
An Earthdata Login account is required to access data from the NASA Earthdata system, including NASA ocean color data.
Summary#
There are two Level-2 (L2) processing suites available for PACE SPEXone data. RemoTAP (Remote Sensing of Trace Gases and Aerosol Products) retrieves aerosol properties over both land and ocean, while FastMAPOL (Fast Multi-Angle Polarimetric Ocean and Land) retrieves both aerosol and ocean color properties over the ocean.
This notebook introduces the SPEXone Level-2 (L2) aerosol products generated by the FastMAPOL algorithm. For a detailed description of the retrieval algorithm and data products, please refer to the associated documentation.
Similar to the HARP2 notebook, we analyze a scene from the Los Angeles wildfire, which includes both smoke and dust events (as observed by OCI and HARP2). However, due to the narrow swath of SPEXone data, the dust event will be the main focus of this tutorial. We will evaluate aerosol optical depth, aerosol absorption, and particle size information.
How to Cite#
If you use the PACE HARP2 MAPOL_OCEAN Version 4.0 data, please refer to the dataset information page for the latest citation and DOI:
https://www.earthdata.nasa.gov/data/catalog/ob-cloud-pace-spexone-l2-mapol-ocean-4.0
The dataset may be cited as:
NASA Ocean Biology Processing Group. (2026). PACE SPEXone Level-2 Regional Aerosol Over Ocean Optical Properties, FastMAPOL Algorithm, Version 4.0. NASA Ocean Biology Distributed Active Archive Center (OB.DAAC). DOI: 10.5067/PACE/SPEXone/L2/MAPOL_OCEAN/4.0. Accessed on: YYYY-MM-DD.
Learning Objectives#
By the end of this notebook, you will understand:
How to acquire SPEXone L2 data
What aerosol products are available
How to visualize basic aerosol properties
How to evaluate data quality
1. Setup#
Begin by importing all of the packages used in this notebook. If your kernel uses an environment defined following the guidance on the tutorials page, then the imports will be successful.
import requests
import earthaccess
import numpy as np
import xarray as xr
from pathlib import Path

import matplotlib.pyplot as plt
from matplotlib.colors import LogNorm
import matplotlib.gridspec as gridspec
import cartopy.crs as ccrs
import cartopy.feature as cfeature
auth = earthaccess.login(persist=True)
2. Get Level-2 Data#
SPEXone L2 data is available on both OB.DAAC and earth data cloud. Please refer L1C notebook on the access of cloud. The following block retrieves a single SPEXone L2 granule at the time stamp 2025/01/09 20:00:19 UTC. V4.0 data is specified in the search.
results = earthaccess.search_data(
    short_name="PACE_SPEXONE_L2_MAPOL_OCEAN",
    temporal=("2025-01-09T20:00:20", "2025-01-09T20:00:21"),
    granule_name='*V4_0*',
    count=1,
)
paths = earthaccess.open(results)
RemoTAP product can be download in the same way by replacing short_name=”PACE_SPEXONE_L2_AER_RTAPOCEAN”
PACE polarimeter L2 products for both HARP2 and SPEXone include four data groups
geolocation_data
geophysical_data
diagnostic_data
sensor_band_parameters
datatree = xr.open_datatree(paths[0])
datatree
<xarray.DataTree>
Group: /
│   Attributes: (12/38)
│       title:                  PACE SPEXONE Level-2 aerosol and ocean product
│       platform:               PACE
│       instrument:             SPEXone
│       startDirection:         Ascending
│       endDirection:           Ascending
│       product_name:           PACE_SPEXONE.20250109T200019.L2.MAPOL_OCEAN.V4_0.nc
│       ...                     ...
│       time_coverage_start:    2025-01-09T20:00:19Z
│       time_coverage_end:      2025-01-09T20:05:19Z
│       reference:              https://doi.org/10.5194/amt-16-5863-2023
│       comments:
│       sun_earth_distance:     0.9833925
│       day_night_flag:         Day
├── Group: /geolocation_data
│       Dimensions:    (number_of_lines: 395, pixels_per_line: 29)
│       Dimensions without coordinates: number_of_lines, pixels_per_line
│       Data variables:
│           latitude   (number_of_lines, pixels_per_line) float32 46kB ...
│           longitude  (number_of_lines, pixels_per_line) float32 46kB ...
├── Group: /geophysical_data
│       Dimensions:              (number_of_lines: 395, pixels_per_line: 29,
│                                 wavelength: 34, number_of_views: 5,
│                                 intensity_bands_per_view: 34)
│       Dimensions without coordinates: number_of_lines, pixels_per_line, wavelength,
│                                       number_of_views, intensity_bands_per_view
│       Data variables: (12/41)
│           alh                  (number_of_lines, pixels_per_line) float32 46kB ...
│           wind_speed           (number_of_lines, pixels_per_line) float32 46kB ...
│           chla                 (number_of_lines, pixels_per_line) float32 46kB ...
│           vd_mode1             (number_of_lines, pixels_per_line) float32 46kB ...
│           vd_mode2             (number_of_lines, pixels_per_line) float32 46kB ...
│           vd_mode3             (number_of_lines, pixels_per_line) float32 46kB ...
│           ...                   ...
│           Rrs_angular_mean     (number_of_lines, pixels_per_line, wavelength) float32 2MB ...
│           Rrs_angular_std      (number_of_lines, pixels_per_line, wavelength) float32 2MB ...
│           Rrs_nadir_mean       (number_of_lines, pixels_per_line, wavelength) float32 2MB ...
│           Rrs_nadir_std        (number_of_lines, pixels_per_line, wavelength) float32 2MB ...
│           Rrs_angular          (number_of_lines, pixels_per_line, number_of_views, intensity_bands_per_view) float32 8MB ...
│           Rrs_nadir            (number_of_lines, pixels_per_line, number_of_views, intensity_bands_per_view) float32 8MB ...
├── Group: /diagnostic_data
│       Dimensions:           (number_of_lines: 395, pixels_per_line: 29,
│                              number_of_views: 5, intensity_bands_per_view: 34,
│                              polarization_bands_per_view: 34)
│       Dimensions without coordinates: number_of_lines, pixels_per_line,
│                                       number_of_views, intensity_bands_per_view,
│                                       polarization_bands_per_view
│       Data variables:
│           chi2              (number_of_lines, pixels_per_line) float32 46kB ...
│           chi2_first_guess  (number_of_lines, pixels_per_line) float32 46kB ...
│           timing            (number_of_lines, pixels_per_line) float32 46kB ...
│           nv_ref            (number_of_lines, pixels_per_line) float64 92kB ...
│           nv_dolp           (number_of_lines, pixels_per_line) float64 92kB ...
│           nfev              (number_of_lines, pixels_per_line) float64 92kB ...
│           njev              (number_of_lines, pixels_per_line) float64 92kB ...
│           quality_flag      (number_of_lines, pixels_per_line) float64 92kB ...
│           ozone             (number_of_lines, pixels_per_line) float32 46kB ...
│           surface_pressure  (number_of_lines, pixels_per_line) float32 46kB ...
│           mask_ref          (number_of_lines, pixels_per_line, number_of_views, intensity_bands_per_view) float32 8MB ...
│           mask_dolp         (number_of_lines, pixels_per_line, number_of_views, polarization_bands_per_view) float32 8MB ...
├── Group: /processing_control
│   └── Group: /processing_control/input_parameters
│           Attributes: (12/141)
│               version:                            v4.5_var1
│               surface:                            ocean
│               prefix:                             global_
│               global_title:                       PACE SPEXONE Level-2 aerosol and ocea...
│               global_comments:
│               global_history:
│               ...                                 ...
│               nall:                               170
│               number_of_views:                    5
│               wavelength:                         34
│               polarization_bands_per_view:        34
│               intensity_bands_per_view:           34
│               sensor_view_angle:                  [-50. -20.   0.  20.  50.]
└── Group: /sensor_band_parameters
        Dimensions:               (number_of_views: 5, intensity_bands_per_view: 34,
                                   wavelength: 34)
        Coordinates:
          * wavelength            (wavelength) float32 136B 407.4 413.2 ... 707.3 748.5
        Dimensions without coordinates: number_of_views, intensity_bands_per_view
        Data variables:
            intensity_wavelength  (number_of_views, intensity_bands_per_view) float32 680B ...
sensor_view_angle (number_of_views) float32 20B ...Here we merge all the data group together for convenience in data manipulations.
dataset = xr.merge(datatree.to_dict().values())
dataset
<xarray.Dataset> Size: 62MB
Dimensions:               (number_of_lines: 395, pixels_per_line: 29,
                           wavelength: 34, number_of_views: 5,
                           intensity_bands_per_view: 34,
                           polarization_bands_per_view: 34)
Coordinates:
  * wavelength            (wavelength) float32 136B 407.4 413.2 ... 707.3 748.5
Dimensions without coordinates: number_of_lines, pixels_per_line,
                                number_of_views, intensity_bands_per_view,
                                polarization_bands_per_view
Data variables: (12/57)
    latitude              (number_of_lines, pixels_per_line) float32 46kB ...
    longitude             (number_of_lines, pixels_per_line) float32 46kB ...
    alh                   (number_of_lines, pixels_per_line) float32 46kB ...
    wind_speed            (number_of_lines, pixels_per_line) float32 46kB ...
    chla                  (number_of_lines, pixels_per_line) float32 46kB ...
    vd_mode1              (number_of_lines, pixels_per_line) float32 46kB ...
    ...                    ...
    ozone                 (number_of_lines, pixels_per_line) float32 46kB ...
    surface_pressure      (number_of_lines, pixels_per_line) float32 46kB ...
    mask_ref              (number_of_lines, pixels_per_line, number_of_views, intensity_bands_per_view) float32 8MB ...
    mask_dolp             (number_of_lines, pixels_per_line, number_of_views, polarization_bands_per_view) float32 8MB ...
    intensity_wavelength  (number_of_views, intensity_bands_per_view) float32 680B ...
    sensor_view_angle     (number_of_views) float32 20B ...
Attributes: (12/38)
    title:                  PACE SPEXONE Level-2 aerosol and ocean product
    platform:               PACE
    instrument:             SPEXone
    startDirection:         Ascending
    endDirection:           Ascending
    product_name:           PACE_SPEXONE.20250109T200019.L2.MAPOL_OCEAN.V4_0.nc
    ...                     ...
    time_coverage_start:    2025-01-09T20:00:19Z
    time_coverage_end:      2025-01-09T20:05:19Z
    reference:              https://doi.org/10.5194/amt-16-5863-2023
    comments:
    sun_earth_distance:     0.9833925
day_night_flag: Day3. Understanding SPEXone L2 product structure#
The SPEXone FastMAPOL L2 product suite includes a long list of aerosol optical properties for both fine and coarse modes (defined in the same format as HARP2 L2 products):
Aerosol optical depth (aot and aot_fine/coarse)
Aerosol single scattering albedo (ssa and ssa_fine/coarse)
Ångström coefficient (angstrom_440_870 and angstrom_440_670)
Aerosol fine mode optical depth fraction (fmf)
etc
As well as aerosol microphysical properties:
Aerosol effective radius (reff_fine/coarse) and variance (veff_fine/coarse)
Aerosol refractive index: real part (mr and mr_fine/coarse), imaginary part (mi and mi_fine/coarse)
Aerosol spherical fraction (sph and sph_fine/coarse)
Aerosol volume density (vd_fine/coarse)
Aerosol fine mode volume fraction (fvf)
Aerosol layer height (alh)
etc
And a set of other products:
Wind speed (wind_speed)
Chlorophyll-a (chla)
datatree["geophysical_data"]
<xarray.DataTree 'geophysical_data'>
Group: /geophysical_data
    Dimensions:              (number_of_lines: 395, pixels_per_line: 29,
                              wavelength: 34, number_of_views: 5,
                              intensity_bands_per_view: 34)
    Dimensions without coordinates: number_of_lines, pixels_per_line, wavelength,
                                    number_of_views, intensity_bands_per_view
    Data variables: (12/41)
        alh                  (number_of_lines, pixels_per_line) float32 46kB ...
        wind_speed           (number_of_lines, pixels_per_line) float32 46kB ...
        chla                 (number_of_lines, pixels_per_line) float32 46kB ...
        vd_mode1             (number_of_lines, pixels_per_line) float32 46kB ...
        vd_mode2             (number_of_lines, pixels_per_line) float32 46kB ...
        vd_mode3             (number_of_lines, pixels_per_line) float32 46kB ...
        ...                   ...
        Rrs_angular_mean     (number_of_lines, pixels_per_line, wavelength) float32 2MB ...
        Rrs_angular_std      (number_of_lines, pixels_per_line, wavelength) float32 2MB ...
        Rrs_nadir_mean       (number_of_lines, pixels_per_line, wavelength) float32 2MB ...
        Rrs_nadir_std        (number_of_lines, pixels_per_line, wavelength) float32 2MB ...
        Rrs_angular          (number_of_lines, pixels_per_line, number_of_views, intensity_bands_per_view) float32 8MB ...
Rrs_nadir (number_of_lines, pixels_per_line, number_of_views, intensity_bands_per_view) float32 8MB ...4. Visulize SPEXone L2 aerosol properties#
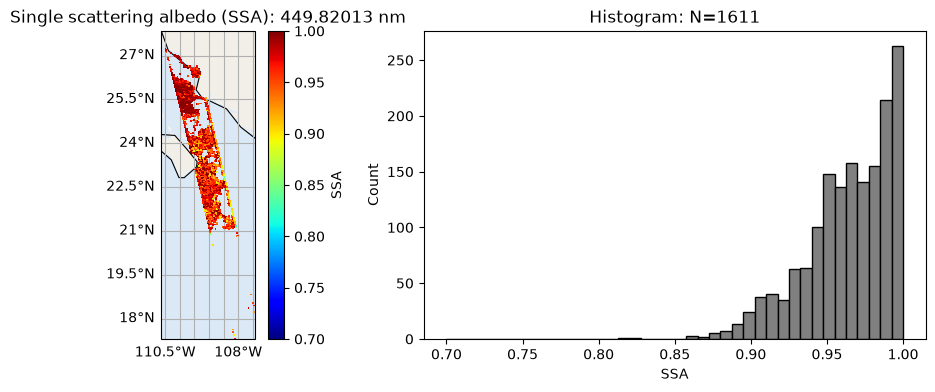
In this example, we visualize the aerosol properties for a scene during LA wild fire with both smoke and dust events. We read the total aerosol optical depth, single scattering albedo, and fine mode volume fraction as below:
aot = dataset["aot"].values
ssa = dataset["ssa"].values
fvf = dataset["fvf"].values
aot.shape, ssa.shape, fvf.shape
((395, 29, 34), (395, 29, 34), (395, 29))
We also need the spatial and angle dimensions as below:
lat = dataset["latitude"].values
lon = dataset["longitude"].values
plot_range = [lon.min(), lon.max(), lat.min(), lat.max()]
wavelength = dataset["wavelength"].values
print(wavelength)
[407.41275 413.2169  419.10376 425.07446 431.13025 437.27228 443.50183
 449.82013 456.22845 462.72806 469.32025 476.00638 482.78775 489.66574
 496.6417  503.71704 510.8932  518.1716  525.55365 533.0409  540.63477
 548.3369  556.1487  564.07184 572.1078  580.2583  588.52484 596.9092
 614.03796 631.6582  668.4302  677.9529  707.3428  748.5206 ]
def plot_l2_product(
    lon, lat, data,
    label, title,
    plot_range=None,
    vmin=None, vmax=None,
    figsize=(12, 4),
    cmap="viridis",
    log_scale=False,
    land_color="#f2efe9",
    ocean_color="#dbe9f6",
):
    """Make map + histogram with optional log color scaling and land/ocean background.

    Notes:
      - Assumes lon/lat are 2D or 1D arrays available in the outer scope
        (or change signature to pass them in).
      - For log_scale=True, only positive values are used for autoscaling and histogram.
    """

    # ------------------
    # Determine vmin / vmax if not given
    # ------------------
    mask_valid = np.isfinite(data)
    valid = data[mask_valid]
    lat_valid, lon_valid = lat[mask_valid], lon[mask_valid]
    if plot_range is None:
        plot_range = [
            lon_valid.min(), lon_valid.max(),
            lat_valid.min(), lat_valid.max()
        ]
    if valid.size == 0:
        raise ValueError("No finite values in `data`.")

    if log_scale:
        valid = valid[valid > 0]
        if valid.size == 0:
            raise ValueError("log_scale=True but `data` has no positive finite values.")

        if vmin is None:
            vmin = np.percentile(valid, 2)
        if vmax is None:
            vmax = np.percentile(valid, 98)

        # Safety: avoid invalid/degenerate bounds
        if (vmin is None) or (vmax is None) or (vmin <= 0) or (vmin >= vmax):
            vmin = float(np.min(valid))
            vmax = float(np.max(valid))

    else:
        if vmin is None:
            vmin = np.percentile(valid, 2)
        if vmax is None:
            vmax = np.percentile(valid, 98)

        if (vmin is None) or (vmax is None) or (vmin >= vmax):
            vmin = float(np.min(valid))
            vmax = float(np.max(valid))

    # ------------------
    # Figure layout
    # ------------------
    fig = plt.figure(figsize=figsize)
    gs = gridspec.GridSpec(16, 48, figure=fig)
    ax_map = fig.add_subplot(gs[:, :22], projection=ccrs.PlateCarree())
    ax_cbar = fig.add_subplot(gs[:, 14:15])
    ax_hist = fig.add_subplot(gs[:, 22:])

    # ------------------
    # Map subplot
    # ------------------
    ax_map.set_extent(plot_range, crs=ccrs.PlateCarree())

    # Land / ocean background (behind data)
    ax_map.add_feature(cfeature.OCEAN, facecolor=ocean_color, zorder=0)
    ax_map.add_feature(cfeature.LAND, facecolor=land_color, zorder=1)

    ax_map.coastlines(resolution="110m", color="black", linewidth=0.8)
    gl = ax_map.gridlines(draw_labels={"bottom": "x", "left": "y"})

    norm = LogNorm(vmin=vmin, vmax=vmax) if log_scale else None

    pm = ax_map.pcolormesh(
        lon, lat, data,
        norm=norm,
        vmin=None if log_scale else vmin,
        vmax=None if log_scale else vmax,
        transform=ccrs.PlateCarree(),
        cmap=cmap,
        zorder=2
    )

    cbar = plt.colorbar(pm, cax=ax_cbar, orientation="vertical", pad=0.2)
    cbar.set_label(label)

    ax_map.set_title(title, fontsize=12)

    # ------------------
    # Histogram subplot
    # ------------------
    hist_data = data[np.isfinite(data)]
    if log_scale:
        hist_data = hist_data[hist_data > 0]
        bins = np.logspace(np.log10(vmin), np.log10(vmax), 40)
        ax_hist.hist(hist_data, bins=bins, color="gray", edgecolor="black")
        ax_hist.set_xscale("log")
    else:
        ax_hist.hist(
            hist_data, bins=40, range=[vmin, vmax],
            color="gray", edgecolor="black"
        )

    ax_hist.set_xlabel(label)
    ax_hist.set_ylabel("Count")
    ax_hist.set_title(f"Histogram: N={hist_data.size}")
    plt.show()
wavelength_index = 7
title = "Aerosol Optical Depth (AOD): " + str(wavelength[wavelength_index]) + " nm"
label = "AOD"
data = aot[:, :, wavelength_index]
plot_l2_product(
    lon, lat, data, label=label, title=title, vmin=0, vmax=0.3, cmap="jet"
)
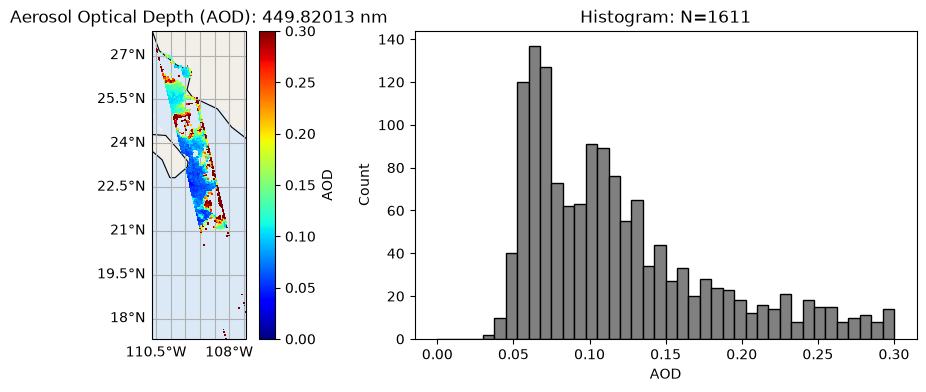
Note high AOD are on the swath and cloud edges which can be removed through quality flagging as discussed later.
wavelength_index = 7
title = "Single scattering albedo (SSA): " + str(wavelength[wavelength_index]) + " nm"
label = "SSA"
data = filtered_ssa = np.where(
    aot[:, :, wavelength_index] > 0.1, ssa[:, :, wavelength_index], np.nan
)
data = ssa[:, :, wavelength_index]
plot_l2_product(
    lon, lat, data, label=label, title=title, vmin=0.7, vmax=1, cmap="jet"
)
wavelength_index = 7
title = "Fine mode fraction"
label = "FVF"
data = fvf
plot_l2_product(
    lon, lat, data, label=label, title=title, vmin=0, vmax=1, cmap="jet"
)
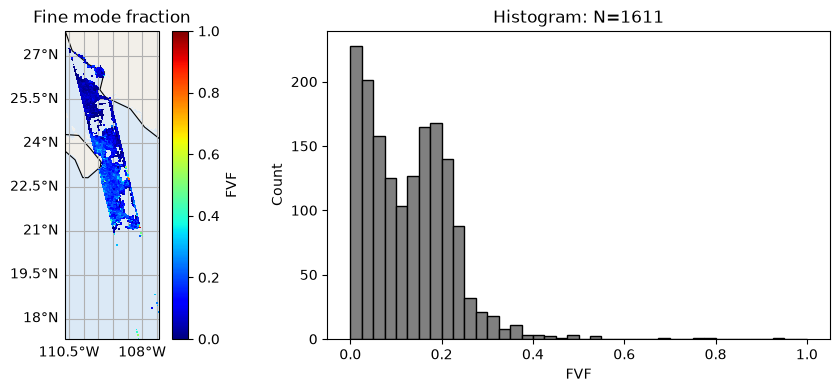
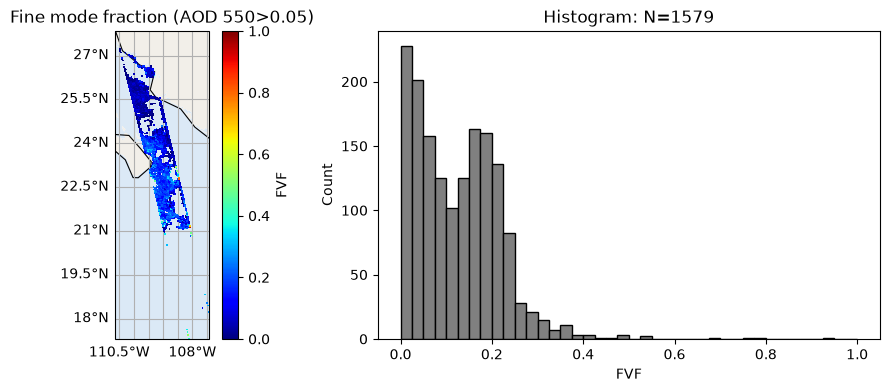
We can clearly see the aerosol event with less absorption (high SSA) and large size (low FVF), probably dust.
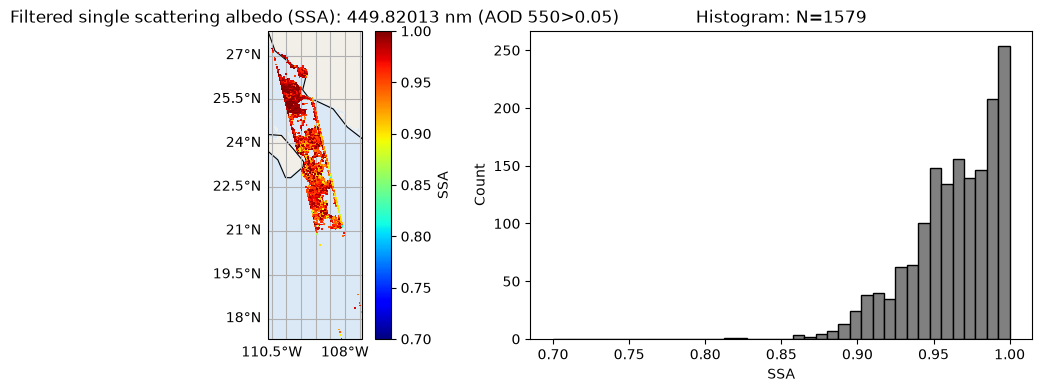
5. Improve data quality: filter low AOD pixels#
Aerosol absorption and microphysics have larger uncertainties when aerosol loading is low. User can further remove low AOD cases when necessary.
wavelength_index = 7
aot_min = 0.05
title = (
    "Filtered single scattering albedo (SSA): "
    + str(wavelength[wavelength_index])
    + " nm (AOD 550>"
    + str(aot_min)
    + ")"
)
label = "SSA"
data = filtered_ssa = np.where(
    aot[:, :, wavelength_index] >= aot_min, ssa[:, :, wavelength_index], np.nan
)
plot_l2_product(
    lon, lat, data, label=label, title=title, vmin=0.7, vmax=1, cmap="jet"
)
The difference in appearance (after matplotlib automatically normalizes the data) is negligible, but the difference in the physical meaning of the array values is quite important.
wavelength_index = 7
aot_min = 0.05
title = "Fine mode fraction (AOD 550>" + str(aot_min) + ")"
label = "FVF"
data = filtered_ssa = np.where(aot[:, :, wavelength_index] >= aot_min, fvf, np.nan)
plot_l2_product(
    lon, lat, data, label=label, title=title, vmin=0, vmax=1, cmap="jet"
)
6. Advanced quality assessment#
Since the retrieval algorithm is based on optimal estimation by minimizing a \(\chi^2\) cost function defined as the difference between measurement (m) and forward model fitting (f), normalized by total uncertainties (\(\sigma\)).
\(\chi^2 = \frac{1}{N} \sum (f - m)^2/\sigma^2\)
Here N is the total number of measureents used in retreival. The algorithm also adaptively evalue fitting performance, if the fitting perform poor, it will be removed from the retreival process. Therefore, the \(\chi^2\) and \(N\) can be used to evaluate retrieval performance, the pixels with small \(\chi^2\) (good fitting) and large \(N\) (more pixels can be fitted) will better quality. A more quantitatively approach based on error propogation can be also used to compute retrieval uncertainty, which will be include in future product.
To support L3 data processing, a quality flag is also defined, which is usually based on \(\chi^2\) and \(N\). For the SPEXone L2 data, we choose
quality_flag = 0: when \(\chi^2<1.5\) and \(N_{ref}>160\) and \(N_{DoLP}>160\)
quality_flag = 1: when \(\chi^2<1.5\) and \(N_{ref}>140\) and \(N_{DoLP}>140\)
quality_flag = 2: when \(\chi^2<2\) and \(N_{ref}>140\) and \(N_{DoLP}>140\)
quality_flag = 3: when \(\chi^2<2\) and \(N_{ref}>100\) and \(N_{DoLP}>100\)
quality_flag > 4: for higher value \(\chi^2\) and lower values of \(N_{ref}\) and \(N_{DoLP}\)
The quality flag definition remained the same with V3_0 data.
chi2 = dataset["chi2"].values
quality_flag = dataset["quality_flag"].values
title = r"Retrieval cost function: $\chi^2$"
label = r"$\chi^2$"
data = chi2
plot_l2_product(
    lon, lat, data, label=label, title=title, vmin=0, vmax=3, cmap="jet"
)
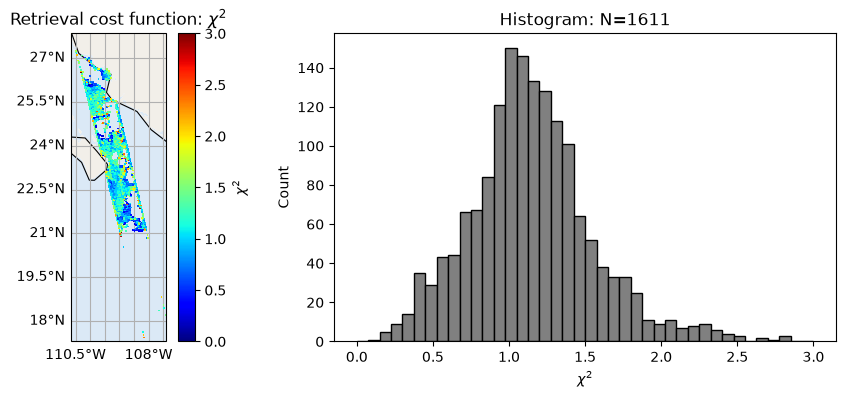
Note that \(\chi^2\) converges reasonably well with peak at 1. There are also pixels which do not converge well with relatively high cost function. These pixels need to be removed for more detailed analysis.
title = "Retrieval quality flag"
label = "quality_flag"
data = quality_flag
plot_l2_product(
    lon, lat, data, label=label, title=title, vmin=0, vmax=3, cmap="viridis"
)
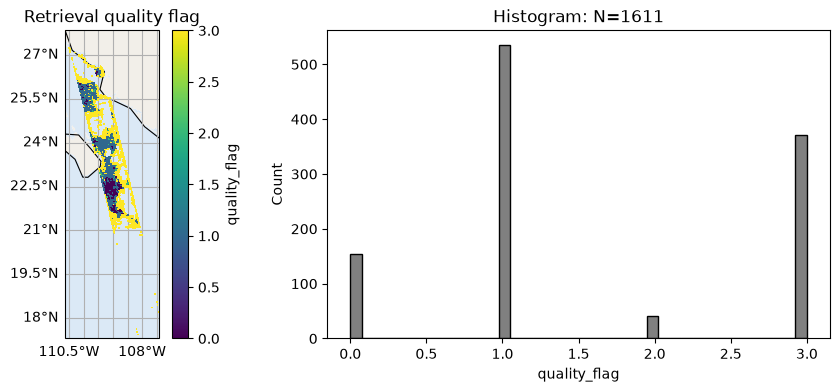
We can evaluate quality flag based on the \(\chi^2\) and \(N\), and most pixels have reach to the best quality with quality_flag=0.
7. Multi-angle data mask for cloud and data screening#
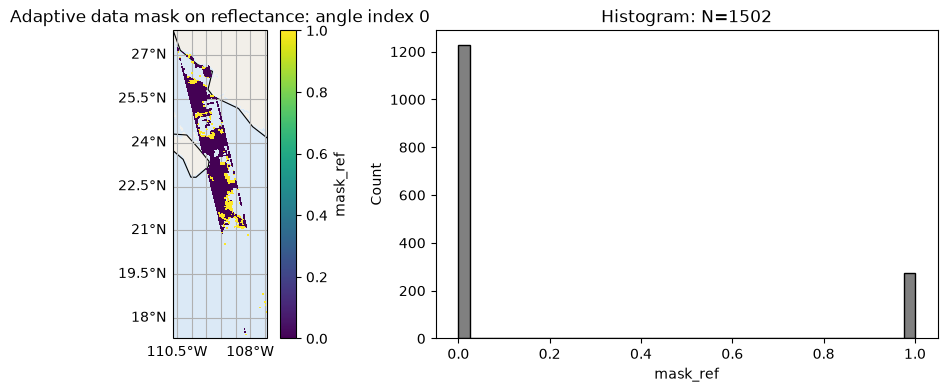
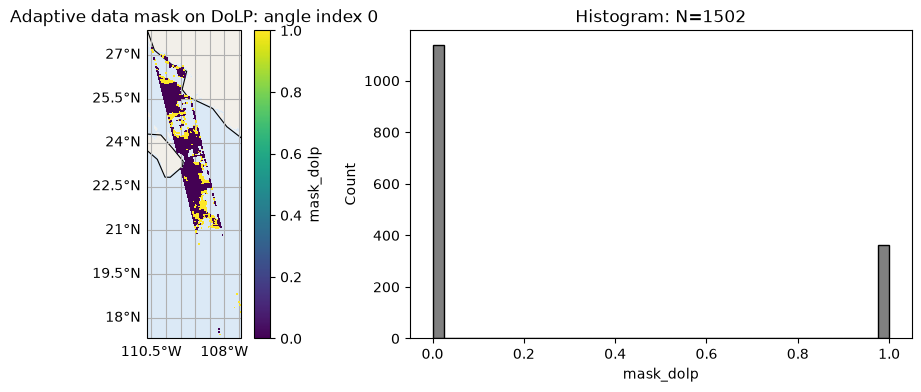
As mentioned previously, FastMAPOL algorithm conducted internal adaptive data screening on each SPEXone angle, the data mask are provided for both reflectance and DoLP. value 0 means the measurements are used in the retrievals, value 1 or NAN means the measurements are removed from retrieval. Therefore, the adaptive data mask can be also used to evaluate fitting quality and measurement quality at each angle. In the example below, please note the difference pattern for reflectance and polarization, which may indicates different calibration perforance.
mask_ref = dataset["mask_ref"].values
mask_dolp = dataset["mask_dolp"].values
mask_ref.shape, mask_dolp.shape
((395, 29, 5, 34), (395, 29, 5, 34))
wavelength_index = 7
angle_index = 0
title = "Adaptive data mask on reflectance: angle index " + str(angle_index)
label = "mask_ref"
data = mask_ref[:, :, angle_index, wavelength_index]
plot_l2_product(
    lon, lat, data, label=label, title=title, vmin=0, vmax=1, cmap="viridis"
)
wavelength_index = 7
angle_index = 0
title = "Adaptive data mask on DoLP: angle index " + str(angle_index)
label = "mask_dolp"
data = mask_dolp[:, :, angle_index, wavelength_index]
plot_l2_product(
    lon, lat, data, label=label, title=title, vmin=0, vmax=1, cmap="viridis"
)
8. [TBD]: pixel level uncertainty estimation.#
As mentioned previously, pixel level uncertainty can be evalated through error propagation, which propgation measurement uncertainty through Jacobian of the forward model. The estimated uncertainties are discussed in (Gao et al 2021) for HARP2 and AirHARP, but currently not included in the HARP2 L2 products.
9. Reference#
[Validation] Gao, M., Aryal, K., Zhai, P.-W., Knobelspiesse, K., Franz, B. A., Cairns, B., Cetinić, I., Fu, G., Hasekamp, O., Ibrahim, A., Sayer, A. M., and Werdell, P. J.: Where sky meets sea: Integrated aerosol and ocean color retrieval from PACE SPEXone multi-angle polarimetry, Remote Sens. Environ., 345, 115603, https://doi.org/10.1016/j.rse.2026.115603, 2026.
[Algorithm] Gao, M., Franz, B. A., Zhai, P.-W., Knobelspiesse, K., Sayer, A. M., Xu, X., Martins, J. V., Cairns, B., Castellanos, P., Fu, G., Hannadige, N., Hasekamp, O., Hu, Y., Ibrahim, A., Patt, F., Puthukkudy, A., and Werdell, P. J.: Simultaneous retrieval of aerosol and ocean properties from PACE HARP2 with uncertainty assessment using cascading neural network radiative transfer models, Atmos. Meas. Tech., 16, 5863–5881, https://doi.org/10.5194/amt-16-5863-2023, 2023.