Paper [RSA]: TROUPE Rover Overview and Analysis
For the paper “Towards a Hazard Assessment Workflow for Assurance of Increasingly Autonomous Systems”
Copyright © 2024, United States Government, as represented by the Administrator of the National Aeronautics and Space Administration. All rights reserved.

The “"Fault Model Design tools - fmdtools version 2"” software is licensed under the Apache License, Version 2.0 (the "License"); you may not use this file except in compliance with the License. You may obtain a copy of the License at http://www.apache.org/licenses/LICENSE-2.0.

Unless required by applicable law or agreed to in writing, software distributed under the License is distributed on an "AS IS" BASIS, WITHOUT WARRANTIES OR CONDITIONS OF ANY KIND, either express or implied. See the License for the specific language governing permissions and limitations under the License.
Model Overview
The system level model for Troupe is defined in model_troupe.py
from fmdtools_examples.navigating_rover.model_troupe import Rover
from fmdtools.sim import propagate
from fmdtools.sim.sample import ParameterSample
from fmdtools.analyze.result import Result
from multiprocessing import Pool
import numpy as np
The model architecture is as follows:
from fmdtools.define.architecture.function import FunctionArchitectureFxnGraph, FunctionArchitectureTypeGraph

mdl = Rover()
mtg = FunctionArchitectureTypeGraph(mdl)
dot = mtg.draw_graphviz()

dot.render('outputs_paper_rsa_troupe/troupe_function_architecture',format='pdf', view=False, cleanup = True)
'outputs_demo_troupe_model\\troupe_function_architecture.pdf'
The model takes three types of parameters:
Ground Control Parameters are inputs from the control
Mission Parameters are simulation parameters
Environment Parameters are parameters to the grid map
mdl.p.ground_control
GroundControlParams(destination=(25, 25), dest_buffer=0.3, speed=0.1)
The ground control parameters include destination, and acceptable destination buffer, and the rovers maximum allowable speed
mdl.p.mission
MissionParams(sense_error_mean=0.0, sense_error_std=0.05, num_waypoints=5, max_sense_delay=4, sense_malfunc_mean=0.0, sense_malfunc_std=0.2, vision_range=5.0, max_ghost_points=1, safety_buffer=0.6)
Mission Parameters are as follows:
loc_pos_error- the maximum error when estimating location and pose by theNavigatefunction. A random error between zero and max is added, which may compund over time steps until theSensefunction sends the actual location and pose.num_waypoints- the number of way points theNavigatefunction will create within the visible range when calculating a path to destination.max_sense_delay- the maximum number of time steps theSensefunction will have a delay in sensing the location and pose. A random number less than the max is chosen during the simulation.sense_malfunc_rate- the error rate when there is a malfunction in theSensefunction.vision_range- this is the maximum range of the lidar/camera.max_ghose_points- This is a maximum number of ghost obstacles the simulation will create when theMapfuntion has theghose_obstacle_detectionfault. A random number between 0 and this is chosen every timestep.
mdl.p.environment
EnvironmentParams(x_size=100, y_size=100, blocksize=0.3, operator_params=GroundControlParams(destination=(25, 25), dest_buffer=0.3, speed=0.1), mission_params=MissionParams(sense_error_mean=0.0, sense_error_std=0.05, num_waypoints=5, max_sense_delay=4, sense_malfunc_mean=0.0, sense_malfunc_std=0.2, vision_range=5.0, max_ghost_points=1, safety_buffer=0.6), num_occupied=50, num_obstacle_clusters=0, cluster_size=10, max_obstacle_length=3, max_obstacle_width=3)
Environment Parameters are as Follows:
x_size- number of grid points in the x directiony_size- number of grid points in the y directionblocksize- size of a gridoperator_params- the Ground Control Parameters which are used to create the end zone in the mapnum_occupied- number of gridpoints that are occupied by obstaclesthe remaining variables are attributes of the grid that we need to support the modeling
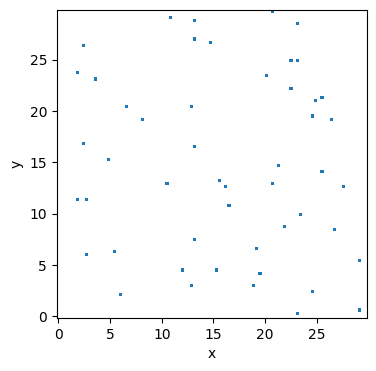
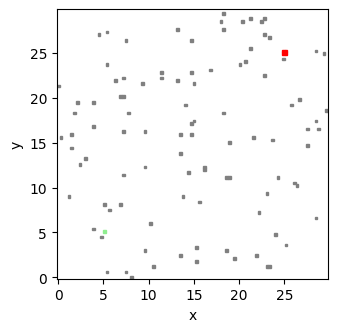
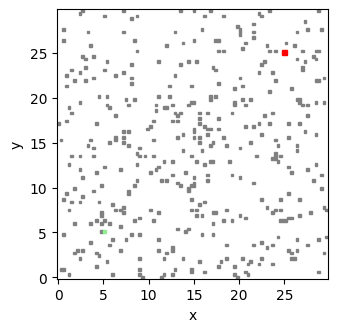
The grid is created based on these parameters, where the obstacles are randomly assigned in a way that 50 percent of the points form clusters of obstacles and the remaining 50 percent form individual obstacles.
The resulting grid looks like following, where the obstacles are the dots in the grid.
fig, ax = mdl.flows['environment'].c.show_collection('all_occupied', label = False)
collection_kwargs={"all_occupied": {"label": "Obstacles", "color": "grey"},
                   "all_endzone": {"label": "End Zone", "color": "red"},
                   "base": {"label": "Base (Start)", "color": "lightgreen"}}
fig, ax = mdl.flows["environment"].c.show(
        {"explored": {}},
        collections=collection_kwargs,
        alpha=0.5, coll_overlay=False, linewidth = 0.0
    )
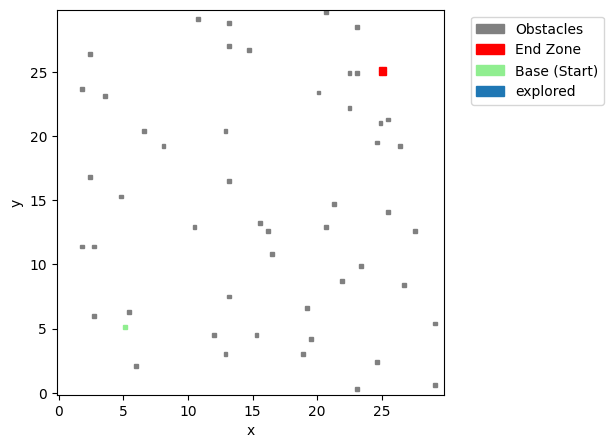
fig.savefig('Troupe_sample_map.pdf')
Analysis
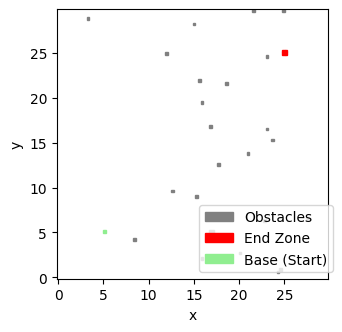
mdl_low = Rover(p={'environment': {'num_occupied': 25}}, r={'seed': 45})
fig, ax = mdl_low.flows['environment'].c.show(collections=collection_kwargs,
                                              legend_kwargs={'bbox_to_anchor': (0.5, 0.2, 0.2, 0.1), 'loc': 'upper left'},
                                              figsize=(3.5,3.5))
# res, hist = propagate.nominal(mdl_low)
res_low_fault, hist_low_fault = propagate.one_fault(mdl_low, "map", "no_obstacle_detection", 50)
len(res_low_fault.nominal.tend.classify.time_between_obstacles)
18
fig, ax = hist_low_fault.plot_trajectories('flows.location_pose.s.curr_x', 'flows.location_pose.s.curr_y', fig=fig, ax=ax,
                                           legend={'bbox_to_anchor': (0.45, 0.25, 0.35, 0.2), 'loc': 'upper left'},
                                           xlabel="x (m)", ylabel="y (m)",
                                           title="Number of Obstacles = 25")
fig
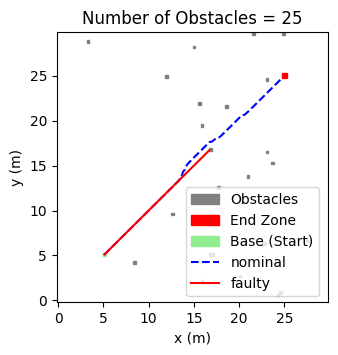
fig.savefig("outputs_paper_rsa_troupe/low_density_obstacle_fault.pdf", bbox_inches="tight", pad_inches=0.0)
length approx 9 => 120 seeds to get to 1000 replicates
ps_low = ParameterSample()
ps_low.add_variable_replicates([], 120)
res_low, hist_low = propagate.parameter_sample(mdl_low, ps_low, pool=Pool(5), max_mem=3e9)
SCENARIOS COMPLETE: 100%|██████████| 120/120 [16:02<00:00, 8.02s/it]
res_low.save("outputs_paper_rsa_troupe/res_25.csv", overwrite=True)
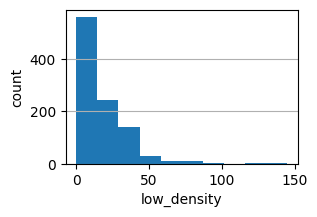
res_low_times = [i for j in res_low.nest(1) for i in res_low.get(j).tend.classify.time_between_obstacles][:1000]
res_all_times = Result(low_density=res_low_times)
res_all_times.plot_metric_dist("low_density")
(<Figure size 300x200 with 1 Axes>,
 [<Axes: xlabel='low_density', ylabel='count'>])
mdl_med = Rover(p={'environment': {'num_occupied': 100}}, r={'seed': 46})
fig, ax = mdl_med.flows['environment'].c.show(collections=collection_kwargs, legend_kwargs=False, figsize=(3.5,3.5))
res_low_fault, hist_low_fault = propagate.one_fault(mdl_med, "map", "no_obstacle_detection", 50)
fig, ax = hist_low_fault.plot_trajectories('flows.location_pose.s.curr_x', 'flows.location_pose.s.curr_y', fig=fig, ax=ax, legend=False,
                                           xlabel="x (m)", ylabel="y (m)",
                                           title="Number of Obstacles = 100")
fig
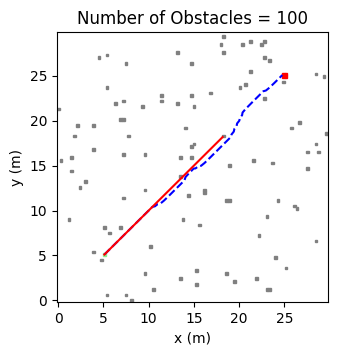
fig.savefig("outputs_paper_rsa_troupe/med_density_obstacle_fault.pdf", bbox_inches="tight", pad_inches=0.0)
len(res_low_fault.nominal.tend.classify.time_between_obstacles)
51
length approx 51 => 20 seeds to get to 1000 replicates
ps_med = ParameterSample()
ps_med.add_variable_replicates([], 20)
ps_med.scenarios()
[ParameterScenario(sequence={}, times=(), p={}, r={'seed': np.uint32(4242300791)}, sp={}, prob=0.05, inputparams={}, rangeid='', name='rep0_var_0'),
 ParameterScenario(sequence={}, times=(), p={}, r={'seed': np.uint32(2065689518)}, sp={}, prob=0.05, inputparams={}, rangeid='', name='rep1_var_1'),
 ParameterScenario(sequence={}, times=(), p={}, r={'seed': np.uint32(1705741432)}, sp={}, prob=0.05, inputparams={}, rangeid='', name='rep2_var_2'),
 ParameterScenario(sequence={}, times=(), p={}, r={'seed': np.uint32(2209154066)}, sp={}, prob=0.05, inputparams={}, rangeid='', name='rep3_var_3'),
 ParameterScenario(sequence={}, times=(), p={}, r={'seed': np.uint32(1079587282)}, sp={}, prob=0.05, inputparams={}, rangeid='', name='rep4_var_4'),
 ParameterScenario(sequence={}, times=(), p={}, r={'seed': np.uint32(3223211407)}, sp={}, prob=0.05, inputparams={}, rangeid='', name='rep5_var_5'),
 ParameterScenario(sequence={}, times=(), p={}, r={'seed': np.uint32(1431434594)}, sp={}, prob=0.05, inputparams={}, rangeid='', name='rep6_var_6'),
 ParameterScenario(sequence={}, times=(), p={}, r={'seed': np.uint32(4268433844)}, sp={}, prob=0.05, inputparams={}, rangeid='', name='rep7_var_7'),
 ParameterScenario(sequence={}, times=(), p={}, r={'seed': np.uint32(543746819)}, sp={}, prob=0.05, inputparams={}, rangeid='', name='rep8_var_8'),
 ParameterScenario(sequence={}, times=(), p={}, r={'seed': np.uint32(3884310516)}, sp={}, prob=0.05, inputparams={}, rangeid='', name='rep9_var_9'),
 ParameterScenario(sequence={}, times=(), p={}, r={'seed': np.uint32(592275038)}, sp={}, prob=0.05, inputparams={}, rangeid='', name='rep10_var_10'),
 ParameterScenario(sequence={}, times=(), p={}, r={'seed': np.uint32(2985741513)}, sp={}, prob=0.05, inputparams={}, rangeid='', name='rep11_var_11'),
 ParameterScenario(sequence={}, times=(), p={}, r={'seed': np.uint32(2548240936)}, sp={}, prob=0.05, inputparams={}, rangeid='', name='rep12_var_12'),
 ParameterScenario(sequence={}, times=(), p={}, r={'seed': np.uint32(1842497667)}, sp={}, prob=0.05, inputparams={}, rangeid='', name='rep13_var_13'),
 ParameterScenario(sequence={}, times=(), p={}, r={'seed': np.uint32(525688870)}, sp={}, prob=0.05, inputparams={}, rangeid='', name='rep14_var_14'),
 ParameterScenario(sequence={}, times=(), p={}, r={'seed': np.uint32(4142226362)}, sp={}, prob=0.05, inputparams={}, rangeid='', name='rep15_var_15'),
 ParameterScenario(sequence={}, times=(), p={}, r={'seed': np.uint32(3127928283)}, sp={}, prob=0.05, inputparams={}, rangeid='', name='rep16_var_16'),
 ParameterScenario(sequence={}, times=(), p={}, r={'seed': np.uint32(1394742035)}, sp={}, prob=0.05, inputparams={}, rangeid='', name='rep17_var_17'),
 ParameterScenario(sequence={}, times=(), p={}, r={'seed': np.uint32(159612496)}, sp={}, prob=0.05, inputparams={}, rangeid='', name='rep18_var_18'),
 ParameterScenario(sequence={}, times=(), p={}, r={'seed': np.uint32(2923648892)}, sp={}, prob=0.05, inputparams={}, rangeid='', name='rep19_var_19')]
res_med, hist_med = propagate.parameter_sample(mdl_med, ps_med, pool=Pool(5))
SCENARIOS COMPLETE: 100%|██████████| 20/20 [03:20<00:00, 10.02s/it]
res_med.save("res_100.csv", overwrite=True)
File already exists: res_100.csv, writing anyway...
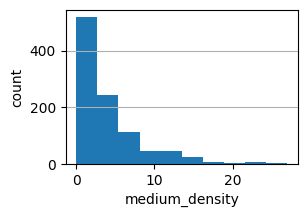
res_med_times = [i for j in res_med.nest(1) for i in res_med.get(j).tend.classify.time_between_obstacles][:1000]
res_all_times['medium_density'] = res_med_times
res_all_times.plot_metric_dist("medium_density")
(<Figure size 300x200 with 1 Axes>,
 [<Axes: xlabel='medium_density', ylabel='count'>])
mdl_hi = Rover(p={'environment': {'num_occupied': 400}}, r={'seed': 19}, sp={'end_time': 500})
fig, ax = mdl_hi.flows['environment'].c.show(collections=collection_kwargs, legend_kwargs=False, figsize=(3.5,3.5))
# res, hist = propagate.nominal(mdl_hi)
res_hi_fault, hist_hi_fault = propagate.one_fault(mdl_hi, "map", "no_obstacle_detection", 75)
len(res_hi_fault.nominal.tend.classify.time_between_obstacles)
198
length approx 200 => 6 seeds to get to 1000 replicates
fig, ax = hist_hi_fault.plot_trajectories('flows.location_pose.s.curr_x', 'flows.location_pose.s.curr_y', fig=fig, ax=ax, legend=False,
                                          xlabel="x (m)", ylabel="y (m)",
                                          title="Number of Obstacles = 400")
fig
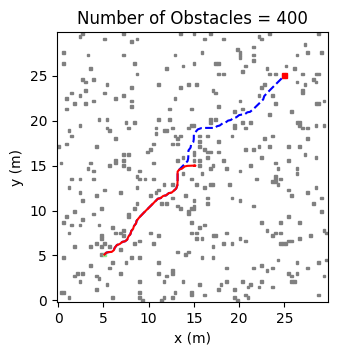
fig.savefig("outputs_paper_rsa_troupe/hi_density_obstacle_fault.pdf", bbox_inches="tight", pad_inches=0.0)
ps_high = ParameterSample()
ps_high.add_variable_replicates([], 8)
ps_high.scenarios()
[ParameterScenario(sequence={}, times=(), p={}, r={'seed': np.uint32(2641063318)}, sp={}, prob=0.125, inputparams={}, rangeid='', name='rep0_var_0'),
 ParameterScenario(sequence={}, times=(), p={}, r={'seed': np.uint32(1630118542)}, sp={}, prob=0.125, inputparams={}, rangeid='', name='rep1_var_1'),
 ParameterScenario(sequence={}, times=(), p={}, r={'seed': np.uint32(3724844472)}, sp={}, prob=0.125, inputparams={}, rangeid='', name='rep2_var_2'),
 ParameterScenario(sequence={}, times=(), p={}, r={'seed': np.uint32(1970292405)}, sp={}, prob=0.125, inputparams={}, rangeid='', name='rep3_var_3'),
 ParameterScenario(sequence={}, times=(), p={}, r={'seed': np.uint32(109488699)}, sp={}, prob=0.125, inputparams={}, rangeid='', name='rep4_var_4'),
 ParameterScenario(sequence={}, times=(), p={}, r={'seed': np.uint32(2042089040)}, sp={}, prob=0.125, inputparams={}, rangeid='', name='rep5_var_5'),
 ParameterScenario(sequence={}, times=(), p={}, r={'seed': np.uint32(3638905161)}, sp={}, prob=0.125, inputparams={}, rangeid='', name='rep6_var_6'),
 ParameterScenario(sequence={}, times=(), p={}, r={'seed': np.uint32(3765052463)}, sp={}, prob=0.125, inputparams={}, rangeid='', name='rep7_var_7')]
res_hi, hist_hi = propagate.parameter_sample(mdl_hi, ps_high, pool=Pool(5))
SCENARIOS COMPLETE: 100%|██████████| 8/8 [02:38<00:00, 19.85s/it]
res_hi.save("outputs_paper_rsa_troupe/res_400.csv", overwrite=True)
File already exists: res_400.csv, writing anyway...
res_hi_times = [i for j in res_hi.nest(1) for i in res_hi.get(j).tend.classify.time_between_obstacles][:1000]
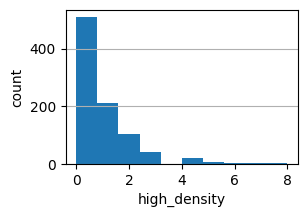
res_all_times['high_density'] = res_hi_times
res_all_times.plot_metric_dist("high_density")
(<Figure size 300x200 with 1 Axes>,
 [<Axes: xlabel='high_density', ylabel='count'>])
Overall Plot(s)
fig, axs = res_all_times.plot_metric_dist("low_density", "medium_density", "high_density", cols=3,
                               metric_bins={'low_density': 15, 'medium_density': 15, 'high_density': 8},
                               title="Detection Intervals Given Obstacle Density",
                               title_padding=0.15,
                               figsize=(7, 1.5))
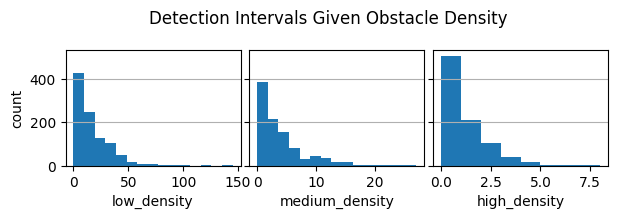
axs[0].set_xlabel("Detection Interval (s)")
axs[0].set_title("25 Objects")
axs[1].set_xlabel("Detection Interval (s)")
axs[1].set_title("100 Objects")
axs[2].set_xlabel("Detection Interval (s)")
axs[2].set_title("400 Objects")
Text(0.5, 1.0, '400 Objects')
fig
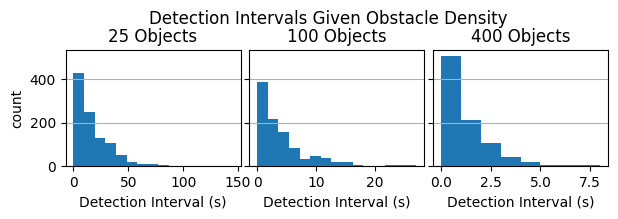
fig.savefig("outputs_paper_rsa_troupe/obstacle_detection_time.pdf", bbox_inches="tight", pad_inches=0.0)
from scipy import stats
stats.percentileofscore(res_all_times.low_density, 50)
np.float64(96.30000000000001)
stats.percentileofscore(res_all_times.medium_density, 50)
np.float64(100.0)
stats.percentileofscore(res_all_times.high_density, 50)
np.float64(100.0)
res_all_times.get_metric()
low_25 = res_all_times.get_metric("low_density", method=np.percentile, args=(25,))
axs[0].vlines(low_25, 0, 600, color="grey", label="25", linestyle=':')
axs[0].text(low_25, 600, "25", ha="center", fontsize=7)

low_avg = res_all_times.get_metric("low_density", method=np.percentile, args=(50,))
axs[0].vlines(low_avg, 0, 600, color="grey", label="50%", linestyle=':')
axs[0].text(low_avg, 600, "50", ha="center", fontsize=7)

low_75 = res_all_times.get_metric("low_density", method=np.percentile, args=(75,))
axs[0].vlines(low_75, 0, 600, color="grey", label="75", linestyle=':')
axs[0].text(low_75, 600, "75", ha="center", fontsize=7)
low_percentiles = [low_25, low_avg, low_75]
low_percentiles
[np.float64(6.0), np.float64(14.5), np.float64(29.0)]
med_25 = res_all_times.get_metric("medium_density", method=np.percentile, args=(25,))
axs[1].vlines(med_25, 0, 600, color="grey", label="25", linestyle=':')
axs[1].text(med_25, 600, "25", ha="center", fontsize=7)

med_avg = res_all_times.get_metric("medium_density", method=np.percentile, args=(50,))
axs[1].vlines(med_avg, 0, 600, color="grey", label="50%", linestyle=':')
axs[1].text(med_avg, 600, "50", ha="center", fontsize=7)

med_75 = res_all_times.get_metric("medium_density", method=np.percentile, args=(75,))
axs[1].vlines(med_75, 0, 600, color="grey", label="75", linestyle=':')
axs[1].text(med_75, 600, "75", ha="center", fontsize=7)
med_percentiles = [med_25, med_avg, med_75]
med_percentiles
[np.float64(1.0), np.float64(3.0), np.float64(5.0)]
hi_25 = res_all_times.get_metric("high_density", method=np.percentile, args=(25,))
axs[2].vlines(hi_25, 0, 600, color="grey", label="25", linestyle=':')
axs[2].text(hi_25, 600, "25", ha="center", fontsize=7)

hi_avg = res_all_times.get_metric("high_density", method=np.percentile, args=(50,))
axs[2].vlines(hi_avg, 0, 600, color="grey", label="50%", linestyle=':')
axs[2].text(hi_avg, 600, "50", ha="center", fontsize=7)

hi_75 = res_all_times.get_metric("high_density", method=np.percentile, args=(75,))
axs[2].vlines(hi_75, 0, 600, color="grey", label="75", linestyle=':')
axs[2].text(hi_75, 600, "75", ha="center", fontsize=7)
hi_percentiles = [hi_25, hi_avg, hi_75]
hi_percentiles
[np.float64(0.0), np.float64(0.0), np.float64(1.0)]
fig.savefig("outputs_paper_rsa_troupe/obstacle_detection_time.pdf", bbox_inches="tight", pad_inches=0.0)