# Install external dependencies
#!pip install -qq harmony-py python-cmr # these are installed in OPENSCAPES, in other environments may need to be installed first
#!pip install -qq gnss_lib_py # this might be needed to work with GPS timePlotting polar cloud variables from PREFIRE data
Summary
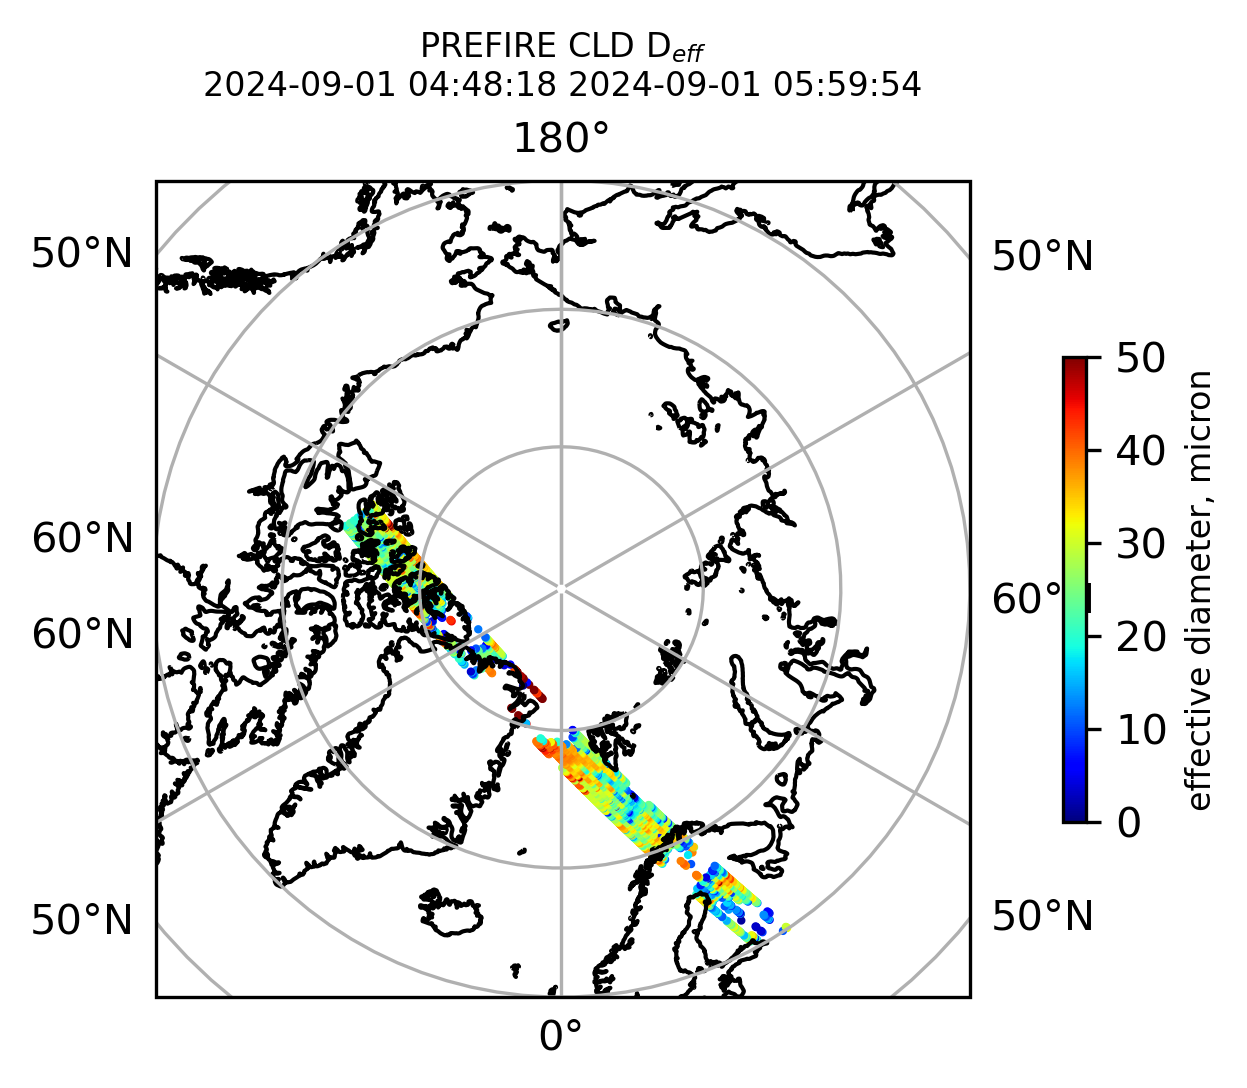
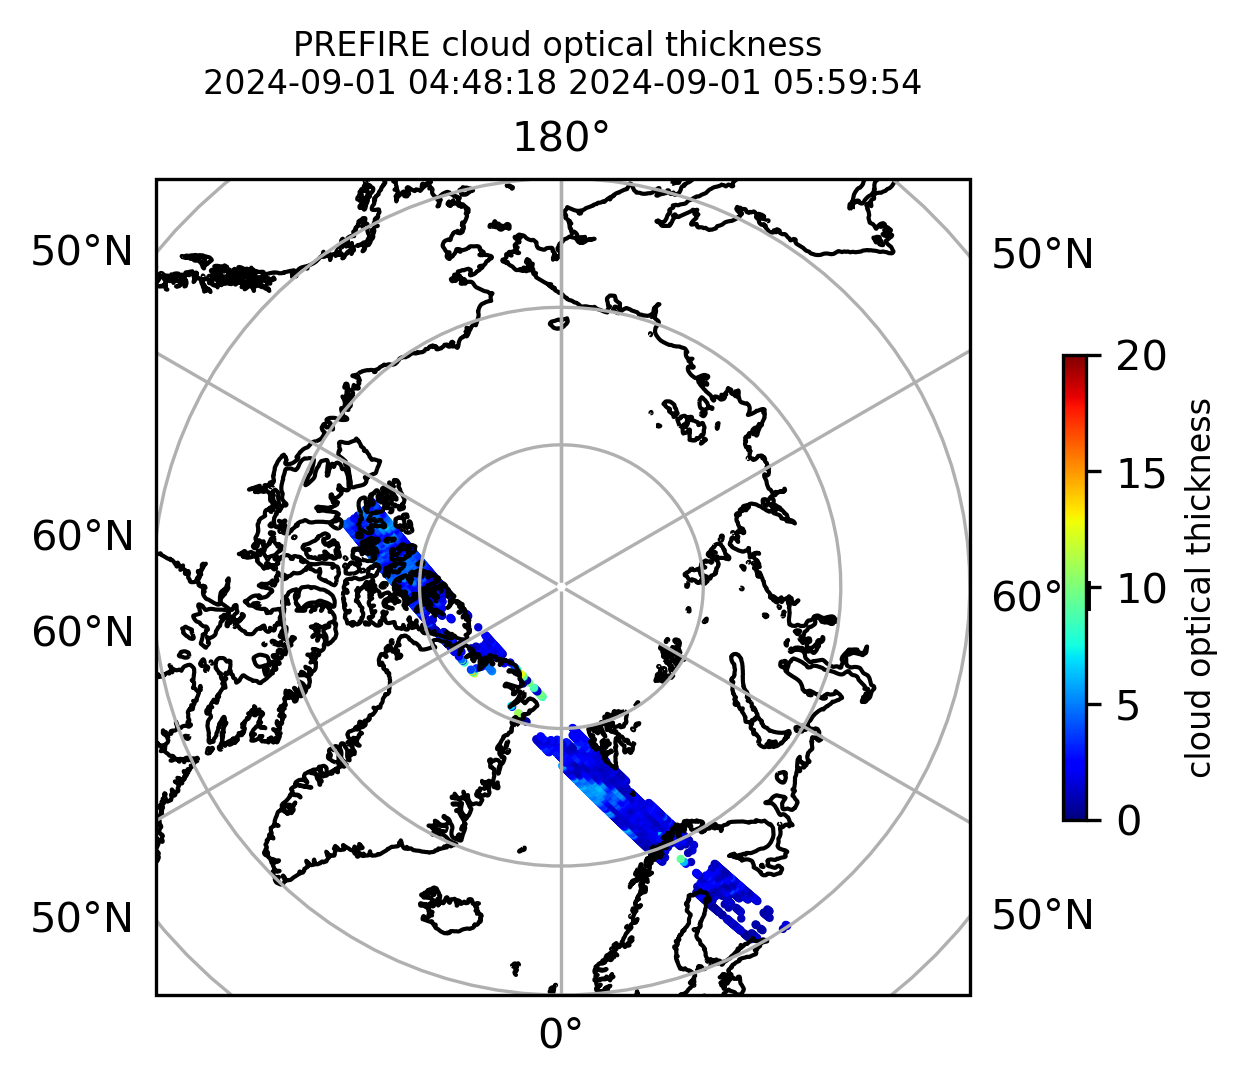
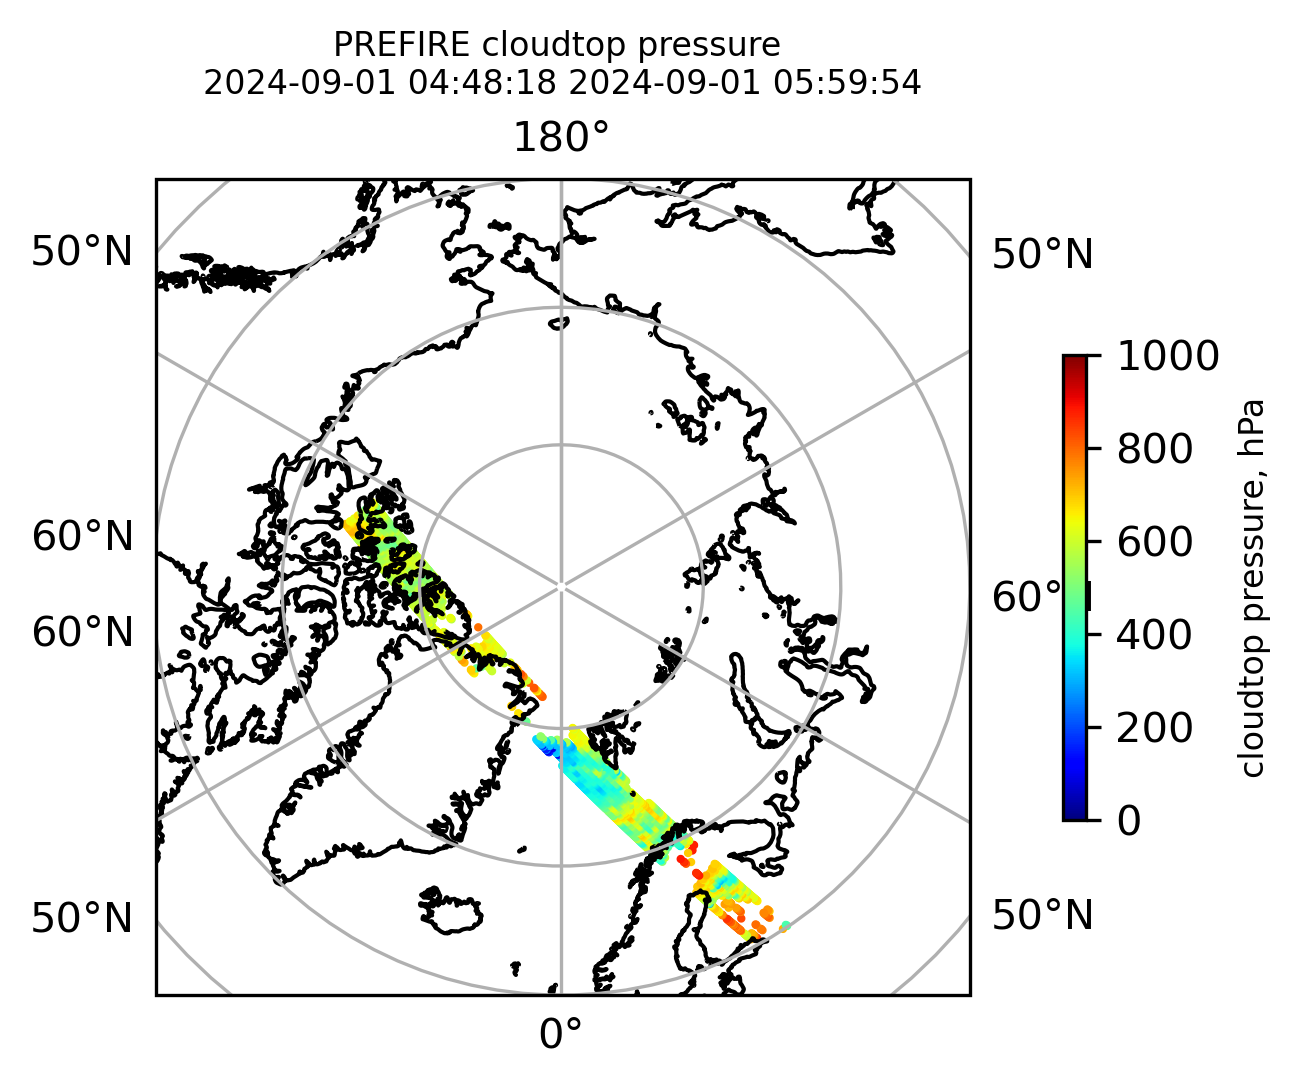
This notebook shows how to retrieve and plot cloud values for the polar region, from Polar Radiant Energy in the Far-InfraRed Experiment (PREFIRE) data.
Prerequisites
- cartopy
- earthaccess
- matplotlib
- netCDF4
- numpy
- harmony-py
Installing libraries
Importing libraries
from datetime import datetime  # needed to work with time in plotting time series
import getpass
import requests

import cartopy.crs as ccrs
import earthaccess  # needed to discover and download TEMPO data
import matplotlib.pyplot as plt  # needed to plot the resulting time series
import netCDF4 as nc  # needed to read TEMPO data
import numpy as np

from harmony import Client, Collection, Request
from harmony.config import Environment
function to read data
def read_PREFIRE_2B_CLD(fn):
try:
with nc.Dataset(fn) as ds:
geo = ds.groups["Geometry"]
var = geo.variables["ctime"]
ctime = np.ma.getdata(var[:])
var = geo.variables["ctime_minus_UTC"]
ctime_minus_UTC = np.ma.getdata(var[:])
var = geo.variables["latitude"]
lat = np.ma.getdata(var[:])
var = geo.variables["longitude"]
lon = np.ma.getdata(var[:])
var = geo.variables["time_UTC_values"]
time_UTC = np.ma.getdata(var[:])
Cld = ds.groups["Cld"]
var = Cld.variables["cld_qc_bitflags"]
bitQF = np.ma.getdata(var[:])
var = Cld.variables["cloud_d_eff"]
cloud_d_eff = np.ma.getdata(var[:])
fv_cloud_d_eff = var.get_fill_value()
var = Cld.variables["cloud_tau"]
cloud_tau = np.ma.getdata(var[:])
fv_cloud_tau = var.get_fill_value()
var = Cld.variables["cloudtop_pressure"]
cloudtop_pressure = np.ma.getdata(var[:])
fv_cloudtop_pressure = var.get_fill_value()
except Exception:
ctime = 0.0
ctime_minus_UTC = 0.0
lat = 0.0
lon = 0.0
time_UTC = 0.0
bitQF = 0.0
cloud_d_eff = 0.0
fv_cloud_d_eff = 0.0
cloud_tau = 0.0
fv_cloud_tau = 0.0
cloudtop_pressure = 0.0
fv_cloudtop_pressure = 0.0
return (
ctime,
ctime_minus_UTC,
lat,
lon,
time_UTC,
bitQF,
cloud_d_eff,
fv_cloud_d_eff,
cloud_tau,
fv_cloud_tau,
cloudtop_pressure,
fv_cloudtop_pressure,
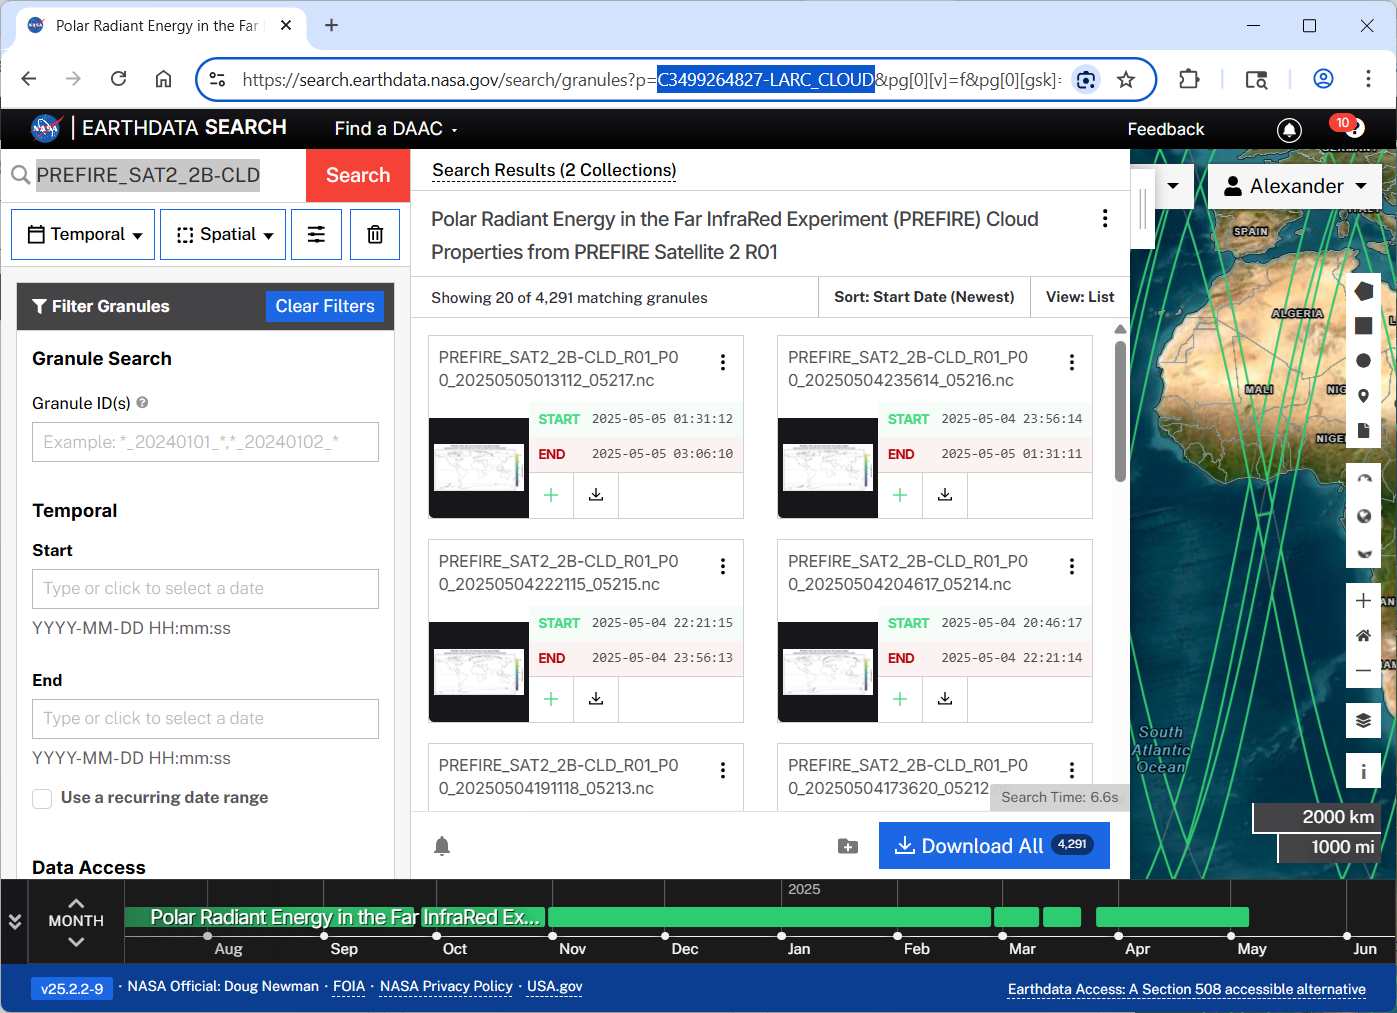
)Getting collection’s conceptID also known as collectionID
from Earthdata search
from Harmony web page
https://harmony.earthdata.nasa.gov/docs#getting-harmony-capabilities-for-a-given-collection-by-collection-short-name:
https://harmony.earthdata.nasa.gov/capabilities?shortName=collection_short_name
we will get a JSON file
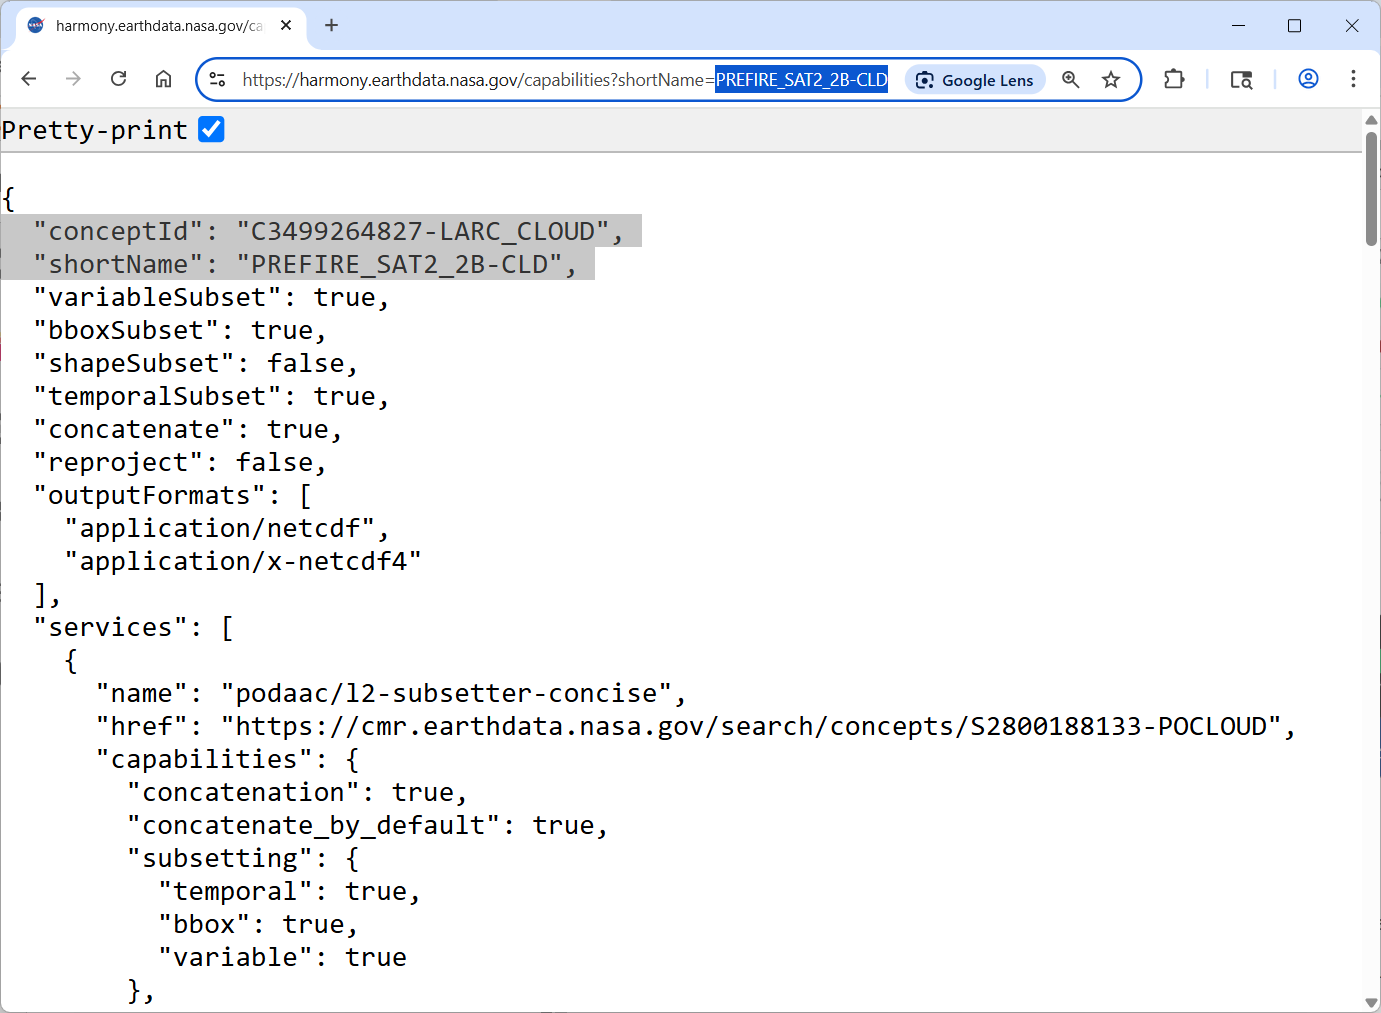
read collection JSON programmatically
short_name = "PREFIRE_SAT2_2B-CLD"
url = "https://harmony.earthdata.nasa.gov/capabilities?shortName=" + short_name

response = requests.get(url)
response.raise_for_status()  # Raise HTTPError for bad responses (4xx or 5xx)

data = response.json()
collectionID = data["conceptId"]
print(f"collectionID for collection short_name {short_name} is {collectionID}")
collectionID for collection short_name PREFIRE_SAT2_2B-CLD is C3499264827-LARC_CLOUDUsing earthaccess library
see
https://earthaccess.readthedocs.io/en/latest/
for more details on this library
login to Earthdata via earthaccess
# User needs to create an account at https://www.earthdata.nasa.gov/
# Function earthaccess.login prompts for EarthData login and password.
auth = earthaccess.login(strategy="interactive", persist=True)
define a function to get collection ID from its short_name and version
def get_collectionID_earthaccess(short_name, version):
    collectionID = "-1"

    results = earthaccess.search_datasets(short_name=short_name, version=version)

    if len(results) == 1:
        collectionID = results[0]["meta"]["concept-id"]
    else:
        raise Exception("Specify valid collection")

    return collectionID
short_name = "PREFIRE_SAT2_2B-CLD"
version = "R01"
collectionID = get_collectionID_earthaccess(short_name, version)
print(
f"collectionID for collection short_name {short_name} and version {version} is {collectionID}"
)collectionID for collection short_name PREFIRE_SAT2_2B-CLD and version R01 is C3499264827-LARC_CLOUDgetting collection ID
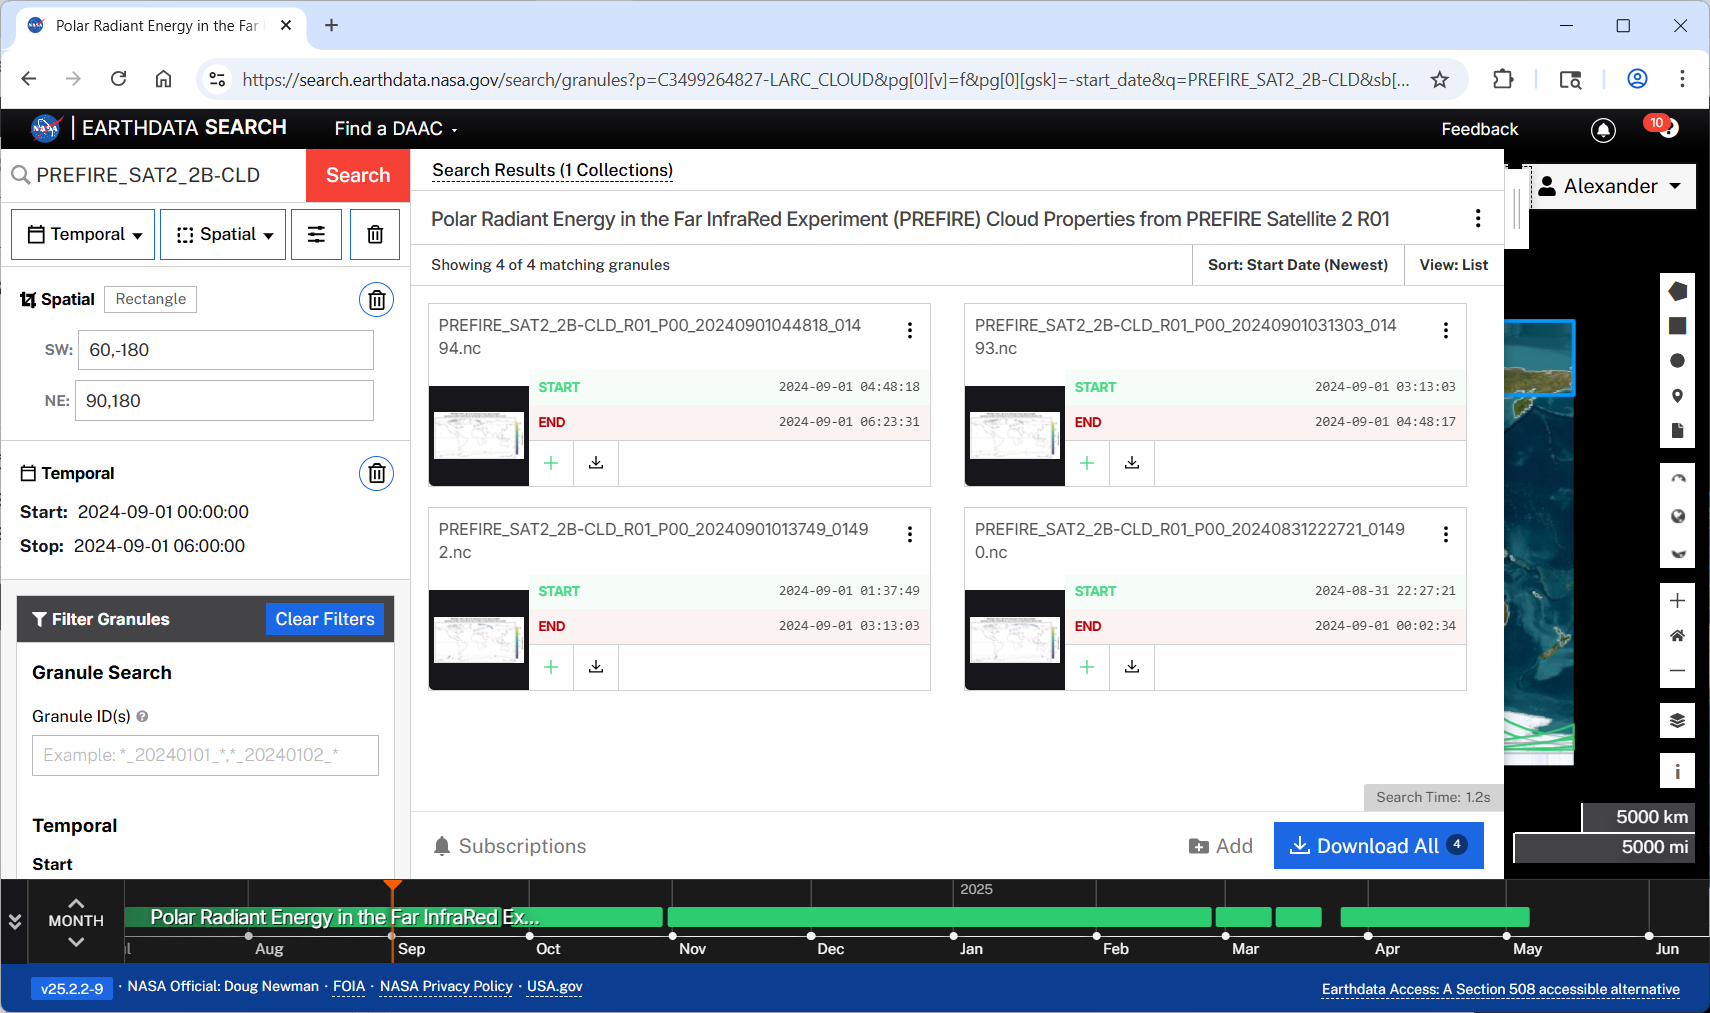
Search for granules using earthaccess library
specify timeframe and/or boundingbox of interest
short_name = "PREFIRE_SAT2_2B-CLD"  # collection name
version = "R01"  # version of the collection

yyyy = 2024
mm = 9
dd = 1

date_start = str("%4.4i-%2.2i-%2.2i 00:00:00" % (yyyy, mm, dd))
date_end = str("%4.4i-%2.2i-%2.2i 06:00:00" % (yyyy, mm, dd))

results_earthaccess = earthaccess.search_data(
    short_name=short_name,
    version=version,
    # bounding_box: a tuple representing spatial bounds in the form
    # (lower_left_lon, lower_left_lat, upper_right_lon, upper_right_lat)
    # where -180 <= lower_left_lon, upper_right_lon < 180,
    #        -90 <= lower_left_lat, upper_right_lat <= 90
    bounding_box=(-180.0, 60.0, 180.0, 90.0),
    temporal=(date_start, date_end),
)
PREFIRE_names = sorted([r["meta"]["native-id"] for r in results_earthaccess])
for name in PREFIRE_names:
    print(name)
PREFIRE_SAT2_2B-CLD_R01_P00_20240831222721_01490.nc
PREFIRE_SAT2_2B-CLD_R01_P00_20240901013749_01492.nc
PREFIRE_SAT2_2B-CLD_R01_P00_20240901031303_01493.nc
PREFIRE_SAT2_2B-CLD_R01_P00_20240901044818_01494.nccompare outcome with Earthdata Search results
Download granules with earthaccess
One-by-one
PREFIRE_links = sorted([r.data_links() for r in results_earthaccess])
for link in PREFIRE_links:
    print(link)
granule = earthaccess.download(link, local_path=".")['https://data.asdc.earthdata.nasa.gov/asdc-prod-protected/PREFIRE/PREFIRE_SAT2_2B-CLD_R01/2024.08.31/PREFIRE_SAT2_2B-CLD_R01_P00_20240831222721_01490.nc']['https://data.asdc.earthdata.nasa.gov/asdc-prod-protected/PREFIRE/PREFIRE_SAT2_2B-CLD_R01/2024.09.01/PREFIRE_SAT2_2B-CLD_R01_P00_20240901013749_01492.nc']['https://data.asdc.earthdata.nasa.gov/asdc-prod-protected/PREFIRE/PREFIRE_SAT2_2B-CLD_R01/2024.09.01/PREFIRE_SAT2_2B-CLD_R01_P00_20240901031303_01493.nc']['https://data.asdc.earthdata.nasa.gov/asdc-prod-protected/PREFIRE/PREFIRE_SAT2_2B-CLD_R01/2024.09.01/PREFIRE_SAT2_2B-CLD_R01_P00_20240901044818_01494.nc']All at once
# remove downloaded granules for demonstration
!rm *.nc
granules = earthaccess.download(results_earthaccess, local_path=".")print("Please provide your Earthdata Login credentials to allow data access")
print("Your credentials will only be passed to Earthdata and will not be exposed in the notebook")
username = input("Username:")
harmony_client = Client(env=Environment.PROD, auth=(username, getpass.getpass()))Please provide your Earthdata Login credentials to allow data access
Your credentials will only be passed to Earthdata and will not be exposed in the notebookUsername: alexrad71
········Logging in with harmony-py
start_date_object = datetime.strptime(date_start, "%Y-%m-%d %H:%M:%S")
end_date_object = datetime.strptime(date_end, "%Y-%m-%d %H:%M:%S")

request = Request(
    collection=Collection(id=collectionID),
    granule_name=PREFIRE_names,
    variables=[
        "Cld/cld_qc_bitflags",
        "Cld/cloud_d_eff",
        "Cld/cloud_tau",
        "Cld/cloudtop_pressure",
        "Geometry/ctime",
        "Geometry/ctime_minus_UTC",
        "Geometry/latitude",
        "Geometry/longitude",
        "Geometry/time_UTC_values",
    ],
    #                , spatial = BBox(-180., 60., 180., 90.)
    temporal={"start": start_date_object, "stop": end_date_object},
)

job_id = harmony_client.submit(request)

harmony_client.wait_for_processing(job_id, show_progress=True)
results = harmony_client.download_all(job_id, directory="./", overwrite=True)
all_results_stored = [f.result() for f in results]
[ Processing: 100% ] |###################################################| [|]./101258408_PREFIRE_SAT2_2B-CLD_R01_P00_20240831222721_01490_subsetted_20240901T044818Z_C3499264827-LARC_CLOUD_merged.nc4searching for the granules’ subset with Harmony
all_results_stored['./101258408_PREFIRE_SAT2_2B-CLD_R01_P00_20240831222721_01490_subsetted_20240901T044818Z_C3499264827-LARC_CLOUD_merged.nc4']if correct subset exist, start from this point
all_results_stored = [
    "./101258408_PREFIRE_SAT2_2B-CLD_R01_P00_20240831222721_01490_subsetted_20240901T044818Z_C3499264827-LARC_CLOUD_merged.nc4"
]
read subset, get number of granules in it
subset_fname = all_results_stored[0].split("/")[-1]
(
    ctime,
    ctime_minus_UTC,
    lat,
    lon,
    time_UTC,
    bitQF,
    cloud_d_eff,
    fv_cloud_d_eff,
    cloud_tau,
    fv_cloud_tau,
    cloudtop_pressure,
    fv_cloudtop_pressure,
) = read_PREFIRE_2B_CLD(subset_fname)
granules_number = ctime.shape[0]
print("number of granules in the subset:", granules_number)number of granules in the subset: 4Plotting variables cloud_d_eff, cloud_tau, cloudtop_pressure
North Pole
for the South Pole the two lines need to be changed in the cell below
1) projection definition:

proj = ccrs.Orthographic(central_longitude=0.0, central_latitude=90.0, globe=None) # North Pole
proj = ccrs.Orthographic(central_longitude=0.0, central_latitude=-90.0, globe=None) # South Pole

2) extent of the plot:

ax1.set_extent([0., 360., 60., 90.], crs=transform) # North Pole
ax1.set_extent([0., 360., -90., -60.], crs=transform) # South Pole
# create arrays of valid values along with arrays of geopositions
for granule_i in range(granules_number):
# find valid beginning and ending times in the slice
for time in time_UTC[granule_i, :, :]:
if time[0] == -9999:
continue
beginning_time_array = time
break
for time in time_UTC[granule_i, -1::-1, :]:
if time[0] == -9999:
continue
ending_time_array = time
break
beginning_time = f"{beginning_time_array[0]:4d}-{beginning_time_array[1]:02d}-{beginning_time_array[2]:02d} {beginning_time_array[3]:02d}:{beginning_time_array[4]:02d}:{beginning_time_array[5]:02d}"
ending_time = f"{ending_time_array[0]:4d}-{ending_time_array[1]:02d}-{ending_time_array[2]:02d} {ending_time_array[3]:02d}:{ending_time_array[4]:02d}:{ending_time_array[5]:02d}"
beginning_time_fn = f"{beginning_time_array[0]:4d}{beginning_time_array[1]:02d}{beginning_time_array[2]:02d}T{beginning_time_array[3]:02d}{beginning_time_array[4]:02d}{beginning_time_array[5]:02d}"
ending_time_fn = f"{ending_time_array[0]:4d}{ending_time_array[1]:02d}{ending_time_array[2]:02d}T{ending_time_array[3]:02d}{ending_time_array[4]:02d}{ending_time_array[5]:02d}"
mask_cloud_d_eff = (cloud_d_eff[granule_i, :, :] != fv_cloud_d_eff) & (
bitQF[granule_i, :, :] == 0
)
mask_cloud_tau = (cloud_tau[granule_i, :, :] != fv_cloud_tau) & (bitQF[granule_i, :, :] == 0)
mask_cloudtop_pressure = (cloudtop_pressure[granule_i, :, :] != fv_cloudtop_pressure) & (
bitQF[granule_i, :, :] == 0
)
valid_cloud_d_eff = cloud_d_eff[granule_i, mask_cloud_d_eff]
valid_cloud_d_eff_lat = lat[granule_i, mask_cloud_d_eff]
valid_cloud_d_eff_lon = lon[granule_i, mask_cloud_d_eff]
valid_cloud_tau = cloud_tau[granule_i, mask_cloud_tau]
valid_cloud_tau_lat = lat[granule_i, mask_cloud_tau]
valid_cloud_tau_lon = lon[granule_i, mask_cloud_tau]
valid_cloudtop_pressure = cloudtop_pressure[granule_i, mask_cloudtop_pressure]
valid_cloudtop_pressure_lat = lat[granule_i, mask_cloudtop_pressure]
valid_cloudtop_pressure_lon = lon[granule_i, mask_cloudtop_pressure]
# Plot arrays in orthografic projection
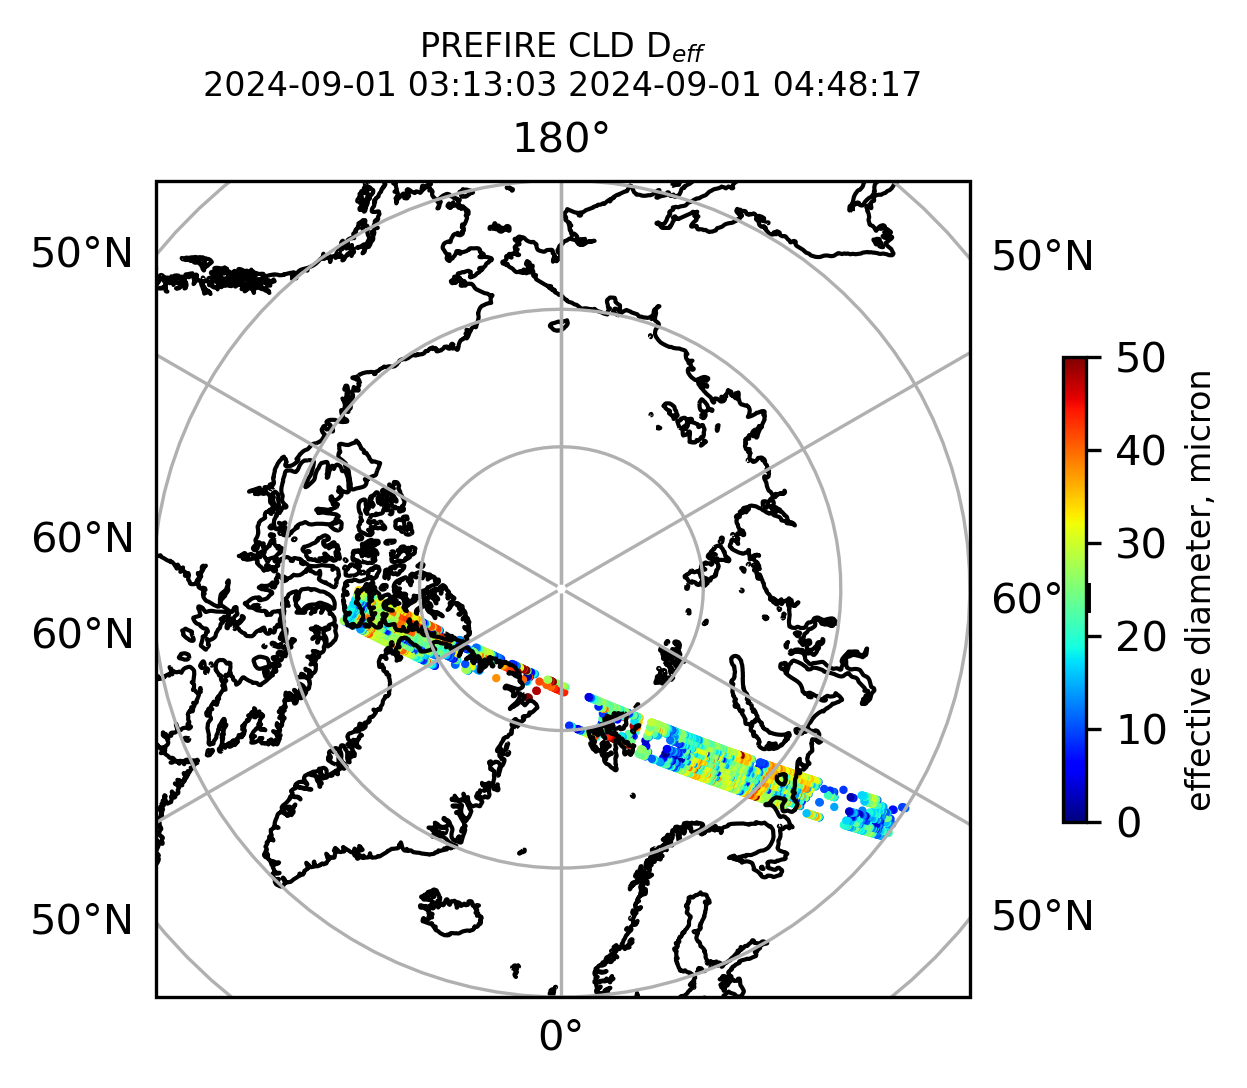
if len(valid_cloud_d_eff) > 0:
fig = plt.figure(figsize=(4, 4), dpi=300, facecolor=None)
proj = ccrs.Orthographic(central_longitude=0.0, central_latitude=90.0, globe=None)
transform = ccrs.PlateCarree()
ax1 = fig.add_subplot(111, projection=proj)
ax1.set_extent([0.0, 360.0, 60.0, 90.0], crs=transform)
im1 = ax1.scatter(
valid_cloud_d_eff_lon,
valid_cloud_d_eff_lat,
c=valid_cloud_d_eff,
s=1.0,
cmap=plt.cm.jet,
vmin=0.0,
vmax=50.0,
transform=transform,
)
ax1.coastlines(resolution="50m", color="black", linewidth=1)
gl = ax1.gridlines(draw_labels=True, dms=True)
gl.xlabels_top = False
gl.ylabels_left = False
cb1 = plt.colorbar(
im1,
ticks=[0, 10.0, 20.0, 30.0, 40.0, 50.0],
fraction=0.025,
pad=0.1,
orientation="vertical",
)
cb1.set_label("effective diameter, micron", fontsize=8)
ax1.set_title("PREFIRE CLD D$_{eff}$ \n" + beginning_time + " " + ending_time, fontsize=8)
plt.savefig(
"PREFIRE_CLD_D_eff_" + beginning_time_fn + "_" + ending_time_fn + ".png", dpi=600
)
plt.show()
plt.close()
else:
print(
f"there is nothing to plot for cloud effective diameter between {beginning_time} and {ending_time}"
)
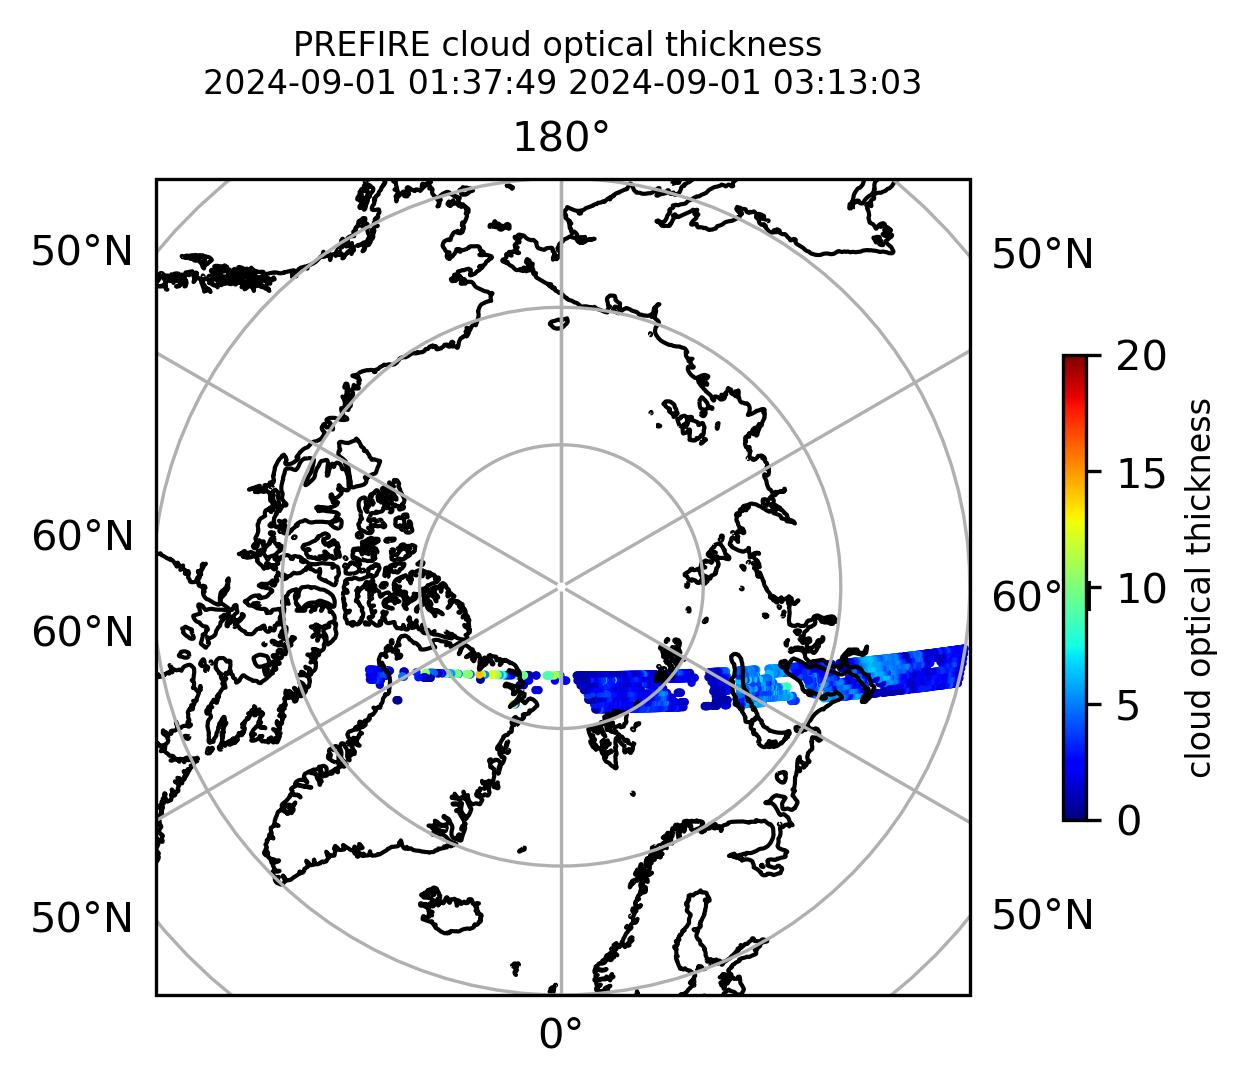
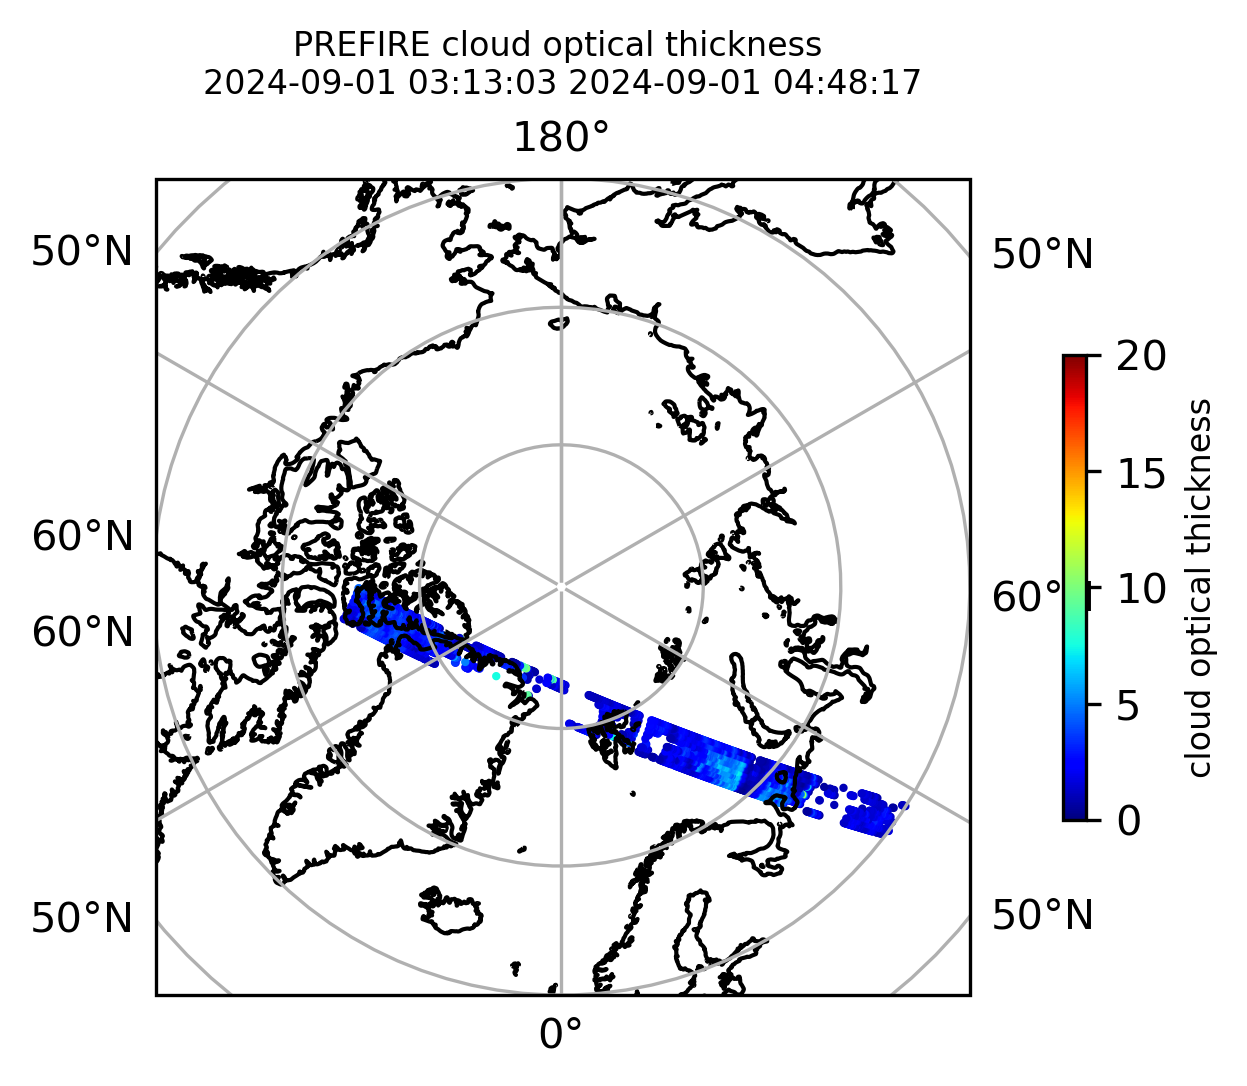
if len(valid_cloud_tau) > 0:
fig = plt.figure(figsize=(4, 4), dpi=300, facecolor=None)
proj = ccrs.Orthographic(central_longitude=0.0, central_latitude=90.0, globe=None)
transform = ccrs.PlateCarree()
ax1 = fig.add_subplot(111, projection=proj)
ax1.set_extent([0.0, 360.0, 60.0, 90.0], crs=transform)
im1 = ax1.scatter(
valid_cloud_tau_lon,
valid_cloud_tau_lat,
c=valid_cloud_tau,
s=1.0,
cmap=plt.cm.jet,
vmin=0.0,
vmax=20.0,
transform=transform,
)
ax1.coastlines(resolution="50m", color="black", linewidth=1)
gl = ax1.gridlines(draw_labels=True, dms=True)
gl.xlabels_top = False
gl.ylabels_left = False
cb1 = plt.colorbar(
im1, ticks=[0, 5.0, 10.0, 15.0, 20.0], fraction=0.025, pad=0.1, orientation="vertical"
)
cb1.set_label("cloud optical thickness", fontsize=8)
ax1.set_title(
"PREFIRE cloud optical thickness \n" + beginning_time + " " + ending_time, fontsize=8
)
plt.savefig("PREFIRE_CLD_tau_" + beginning_time_fn + "_" + ending_time_fn + ".png", dpi=600)
plt.show()
plt.close()
else:
print(
f"there is nothing to plot for cloud optical thickness between {beginning_time} and {ending_time}"
)
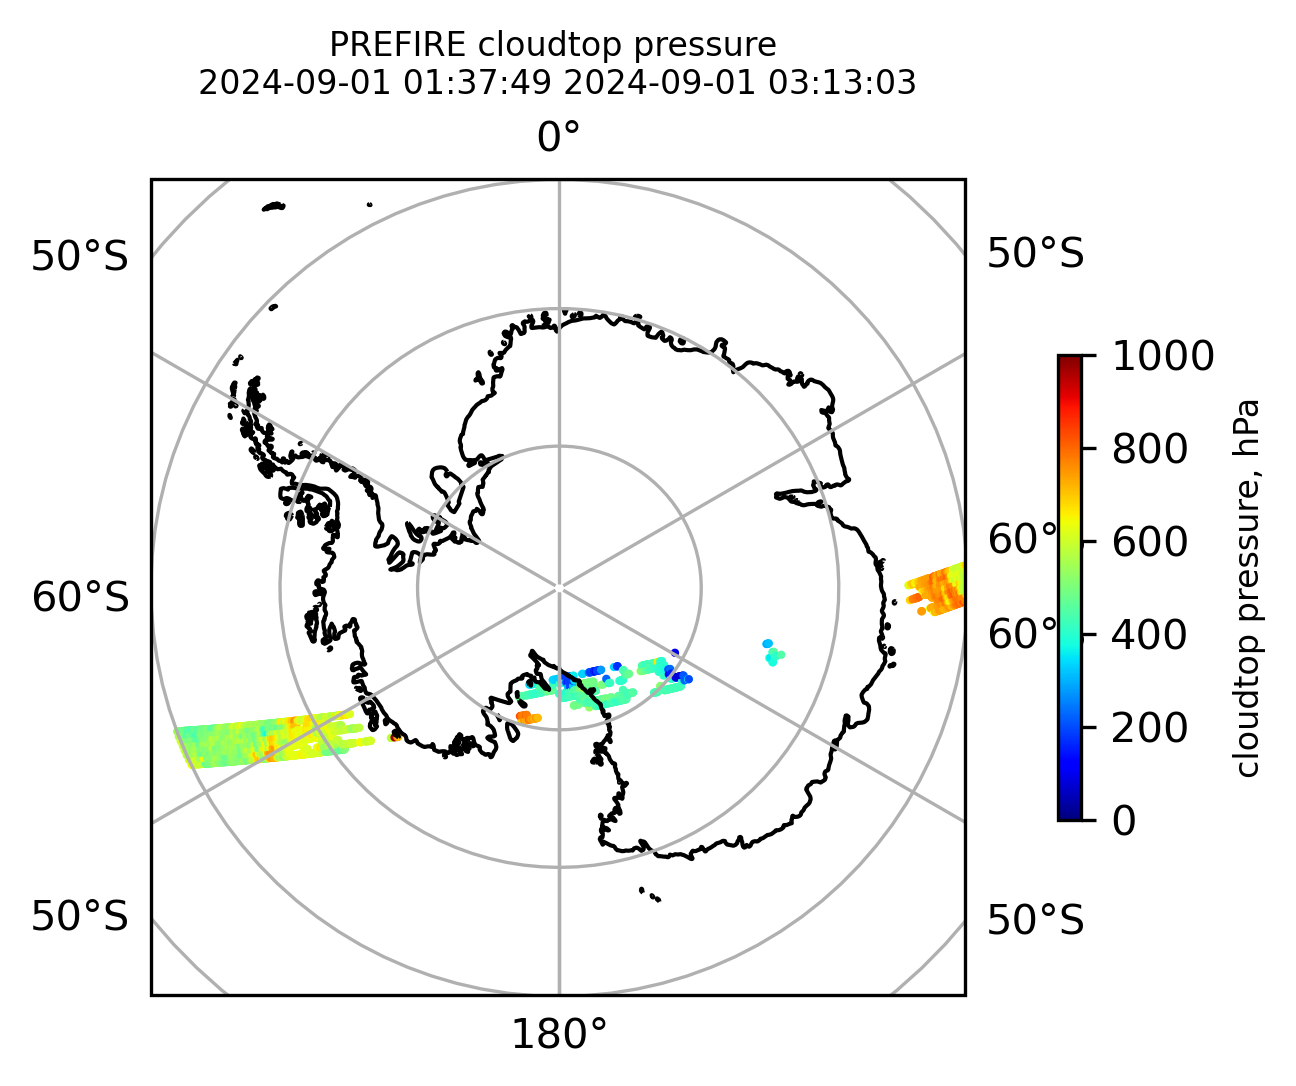
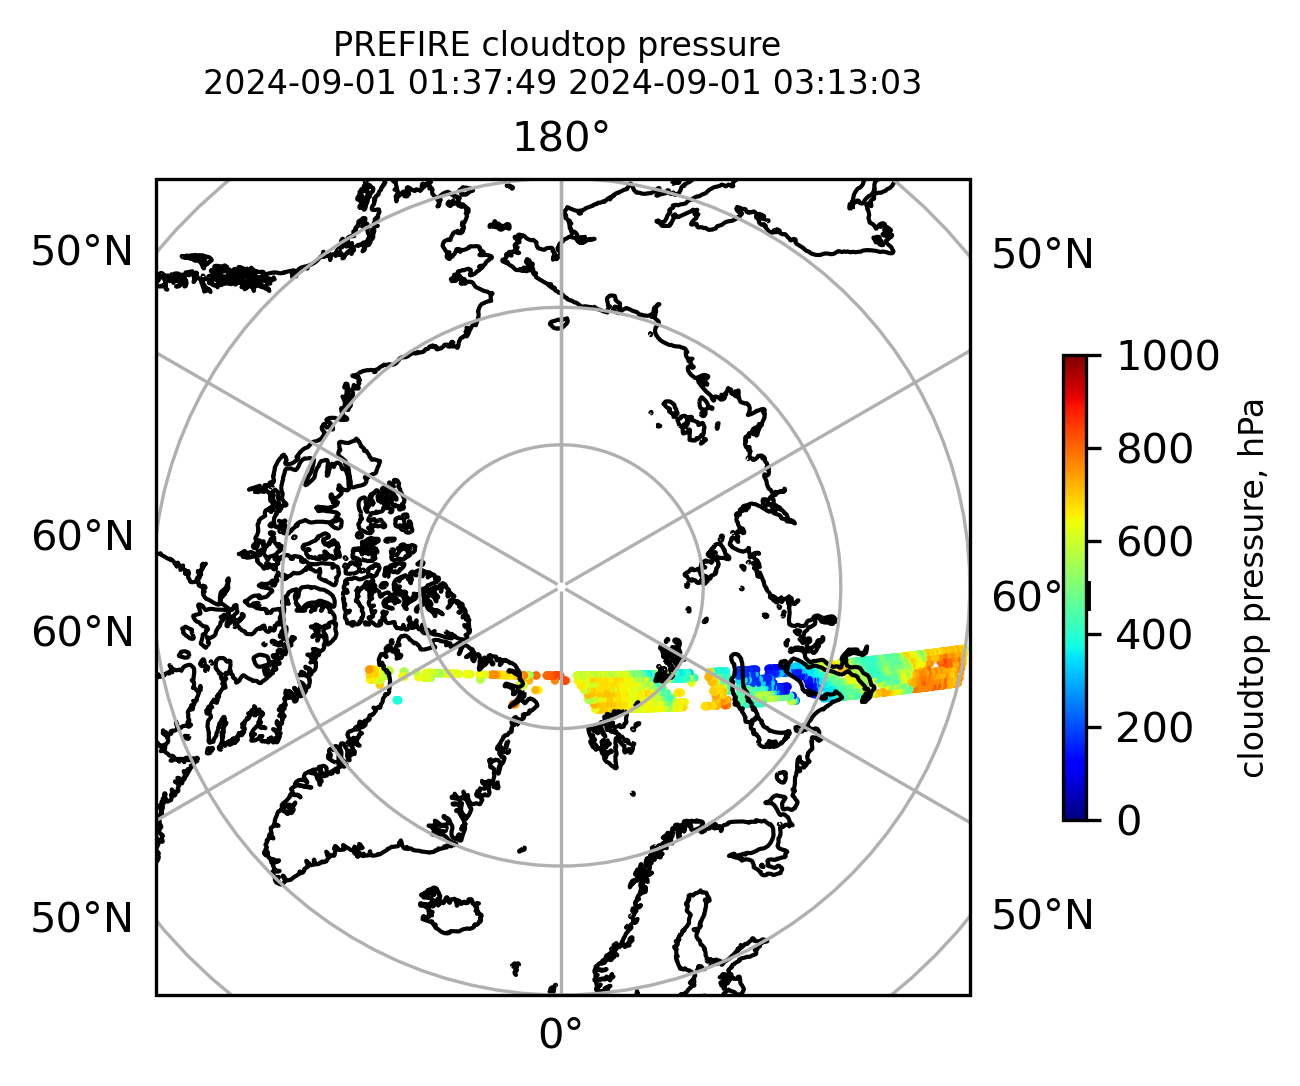
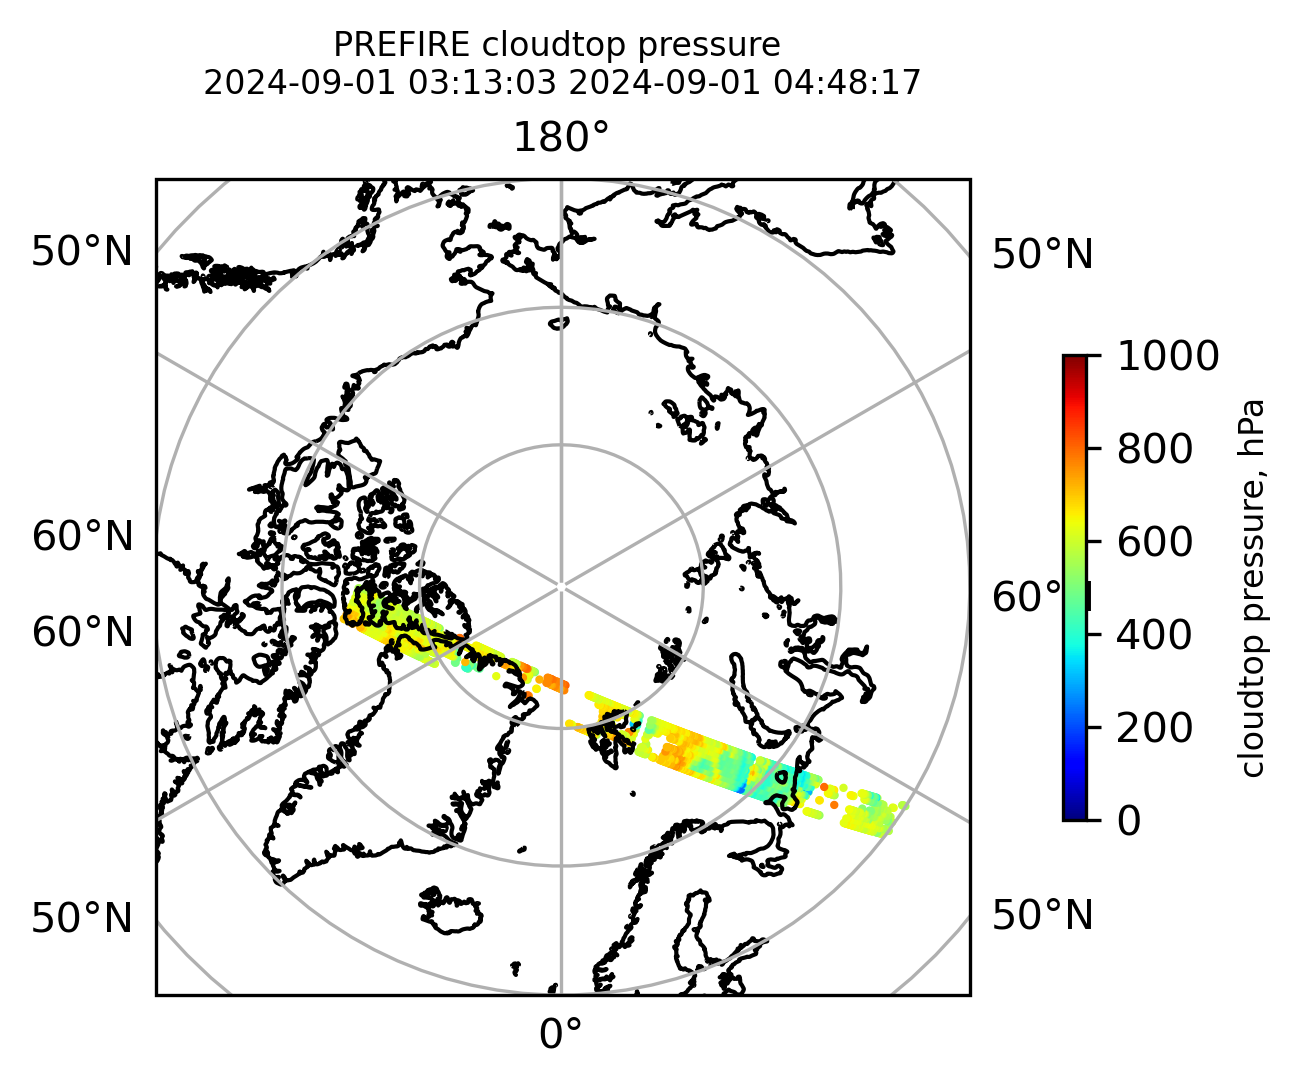
if len(valid_cloudtop_pressure) > 0:
fig = plt.figure(figsize=(4, 4), dpi=300, facecolor=None)
proj = ccrs.Orthographic(central_longitude=0.0, central_latitude=90.0, globe=None)
transform = ccrs.PlateCarree()
ax1 = fig.add_subplot(111, projection=proj)
ax1.set_extent([0.0, 360.0, 60.0, 90.0], crs=transform)
im1 = ax1.scatter(
valid_cloudtop_pressure_lon,
valid_cloudtop_pressure_lat,
c=valid_cloudtop_pressure,
s=1.0,
cmap=plt.cm.jet,
vmin=0.0,
vmax=1000.0,
transform=transform,
)
ax1.coastlines(resolution="50m", color="black", linewidth=1)
gl = ax1.gridlines(draw_labels=True, dms=True)
gl.xlabels_top = False
gl.ylabels_left = False
cb1 = plt.colorbar(
im1,
ticks=[0, 200.0, 400.0, 600.0, 800.0, 1000.0],
fraction=0.025,
pad=0.1,
orientation="vertical",
)
cb1.set_label("cloudtop pressure, hPa", fontsize=8)
ax1.set_title(
"PREFIRE cloudtop pressure \n" + beginning_time + " " + ending_time, fontsize=8
)
plt.savefig(
"PREFIRE_CLDTOP_pressure_" + beginning_time_fn + "_" + ending_time_fn + ".png", dpi=600
)
plt.show()
plt.close()
else:
print(
f"there is nothing to plot for cloudtop pressure between {beginning_time} and {ending_time}"
)there is nothing to plot for cloud effective diameter between 2024-08-31 23:59:55 and 2024-09-01 00:02:34
there is nothing to plot for cloud optical thickness between 2024-08-31 23:59:55 and 2024-09-01 00:02:34
there is nothing to plot for cloudtop pressure between 2024-08-31 23:59:55 and 2024-09-01 00:02:34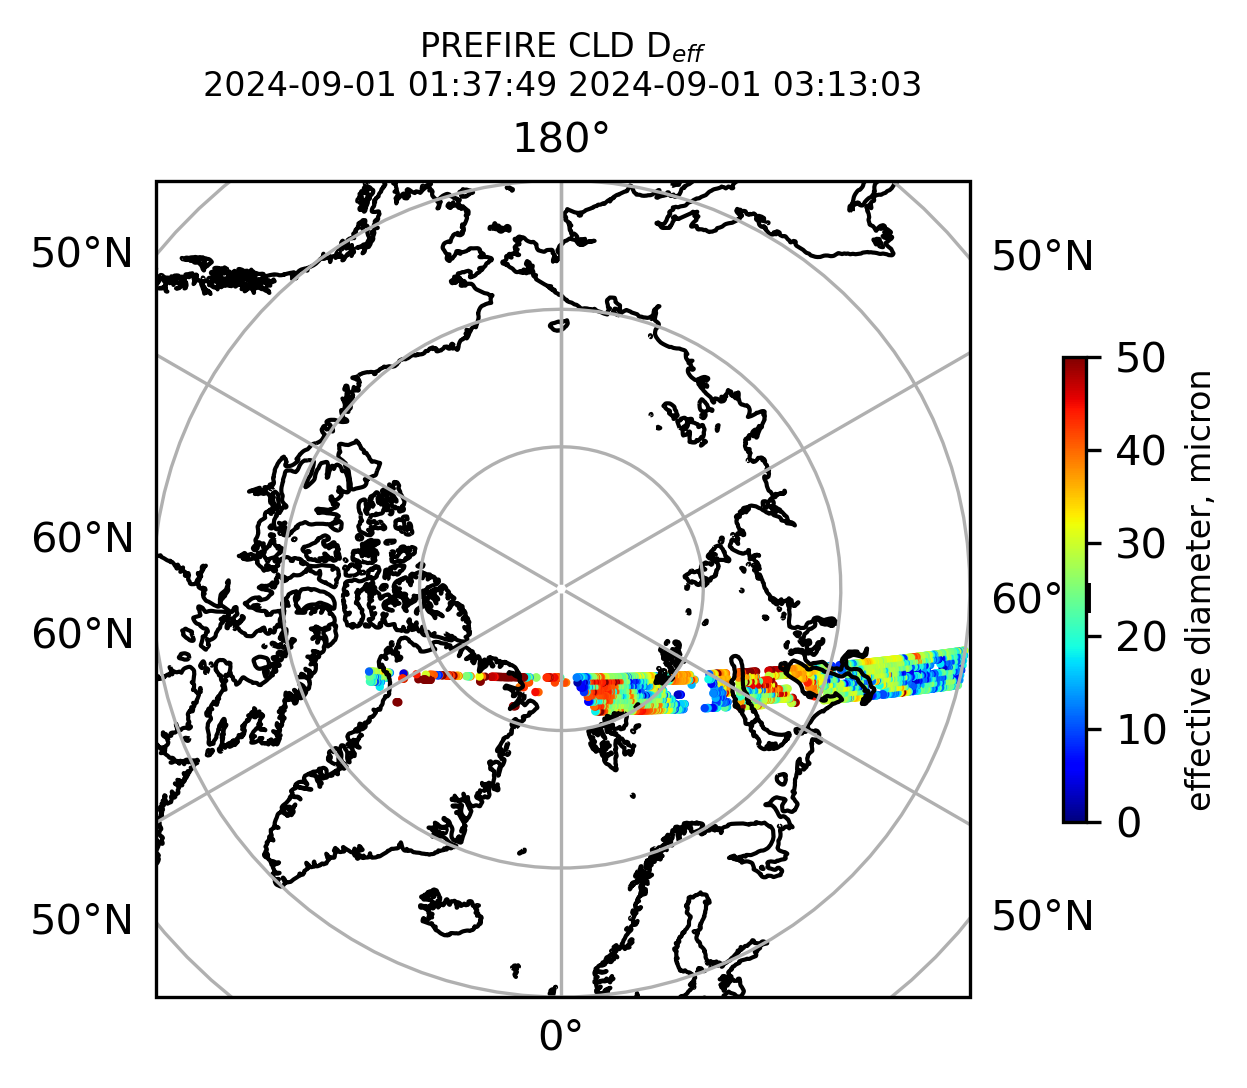
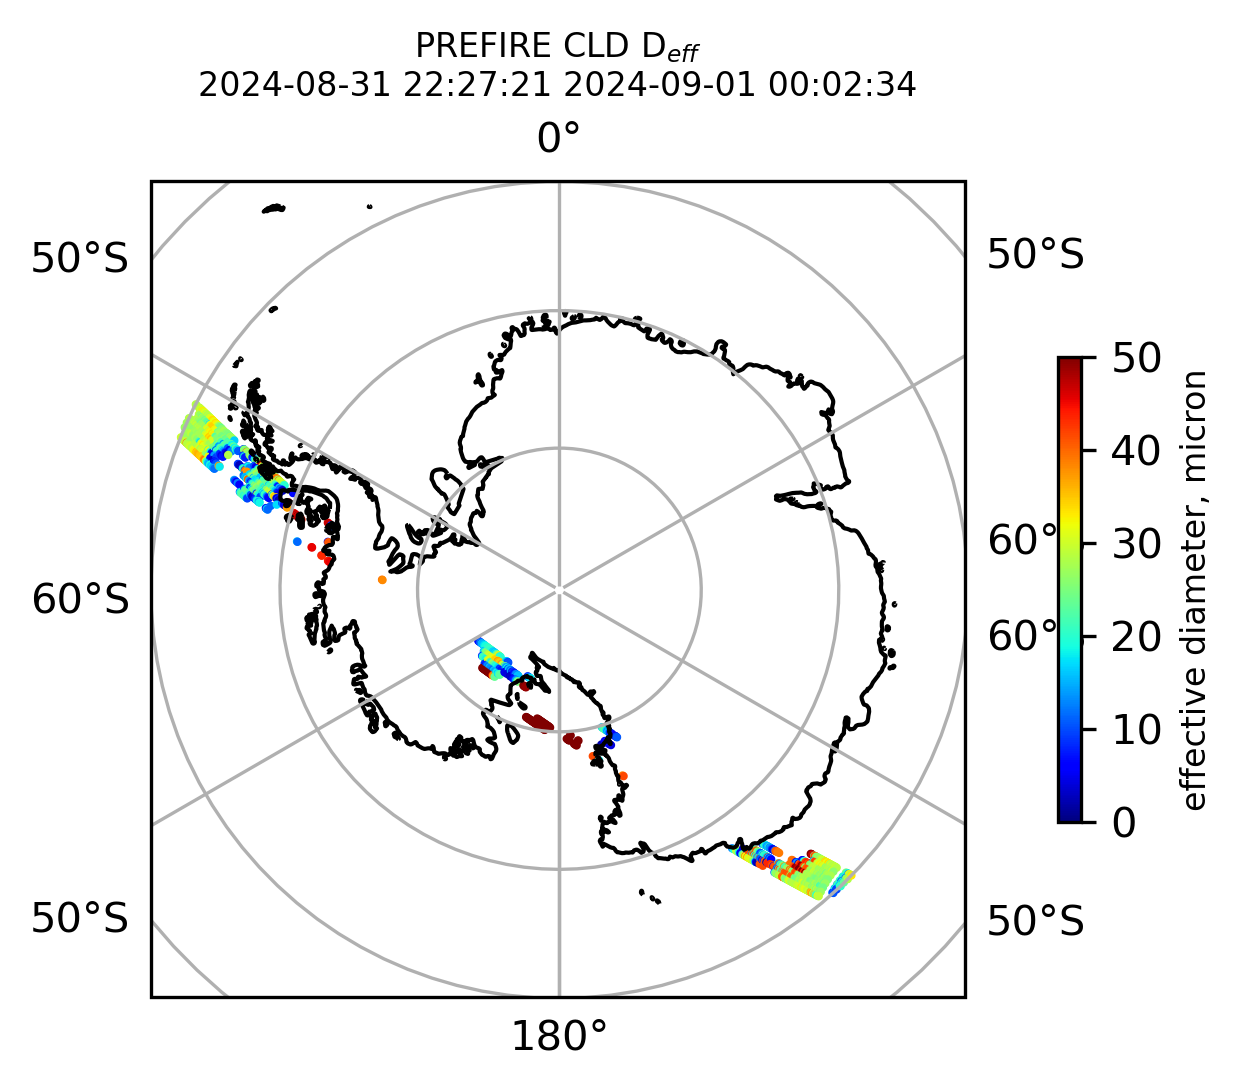
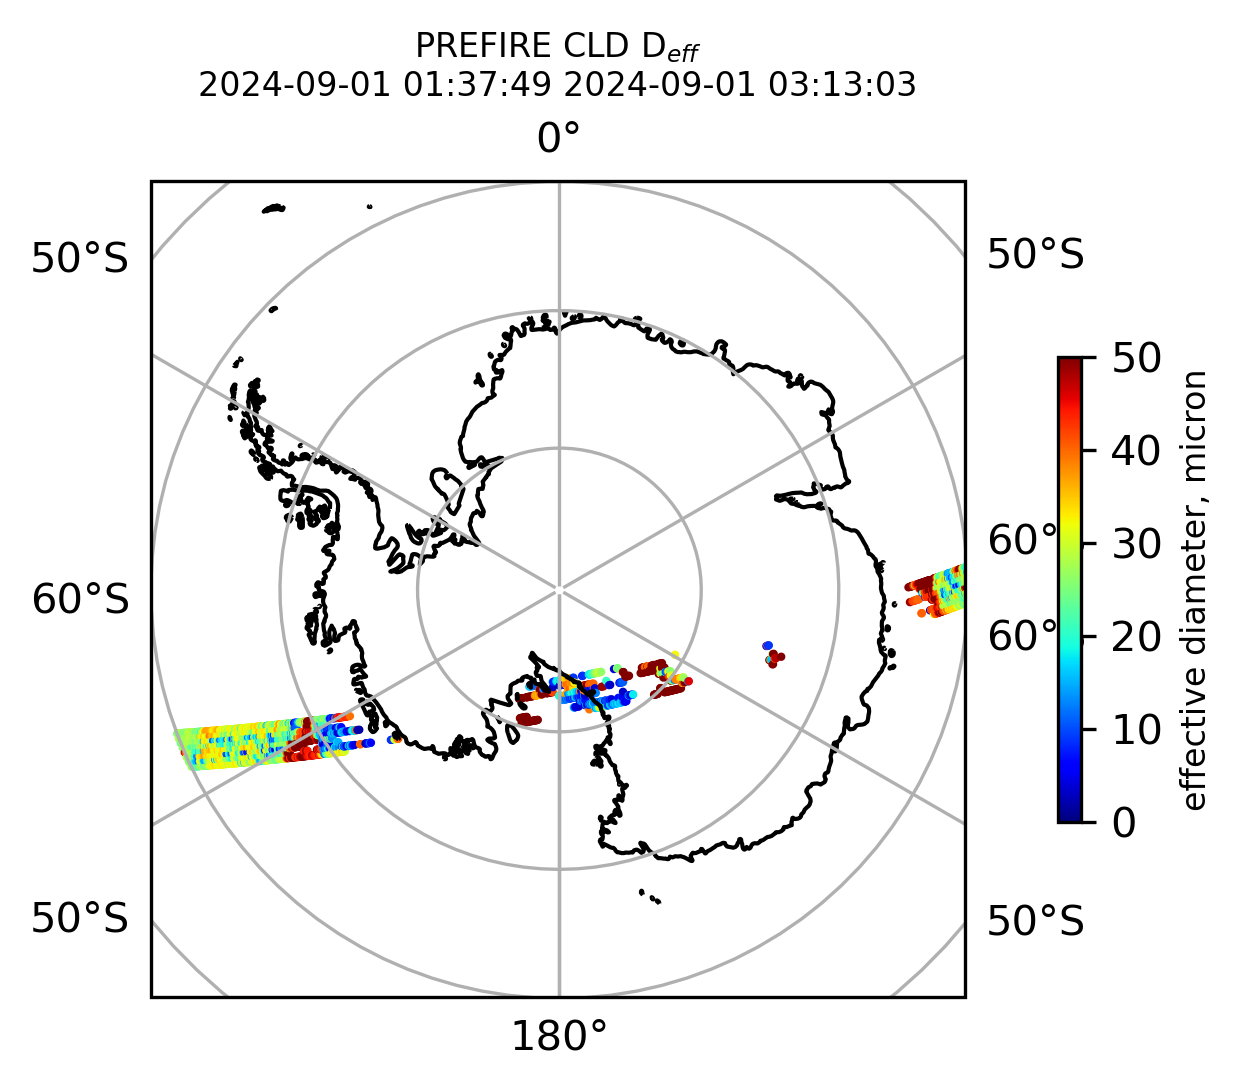
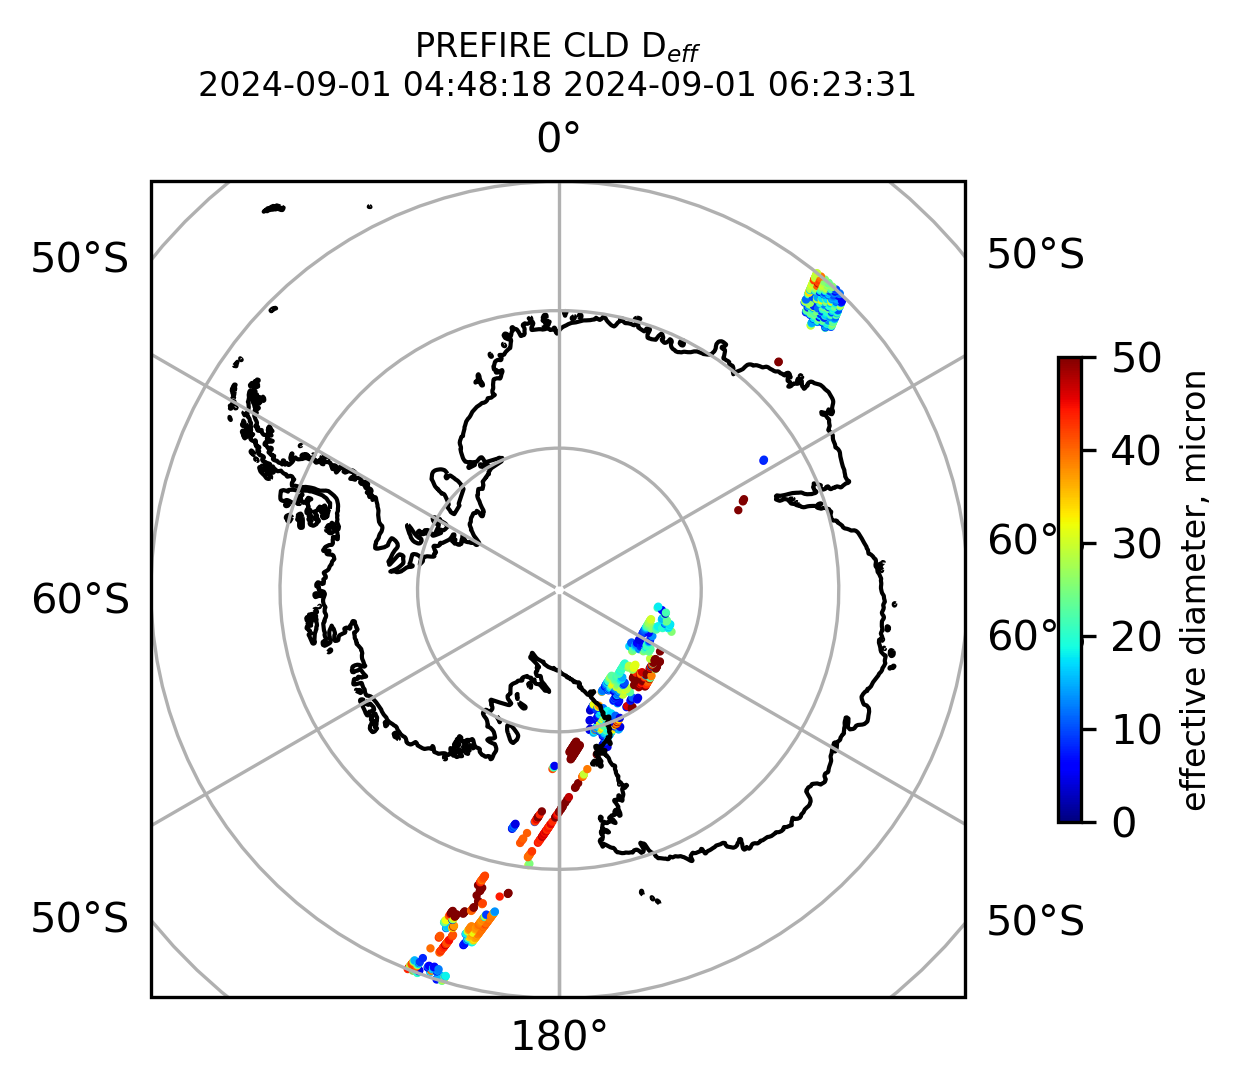
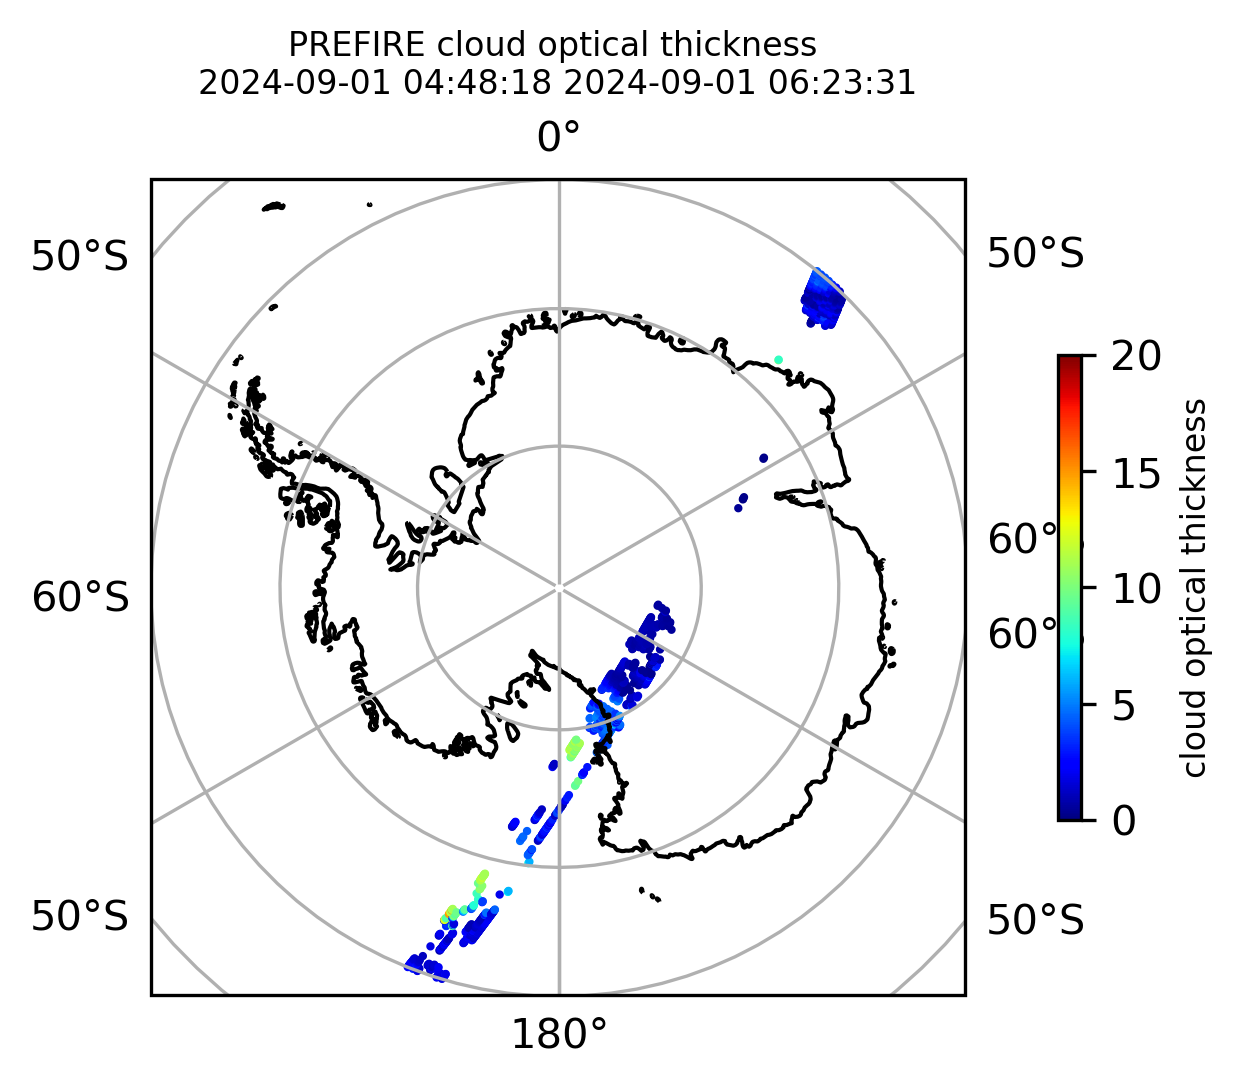
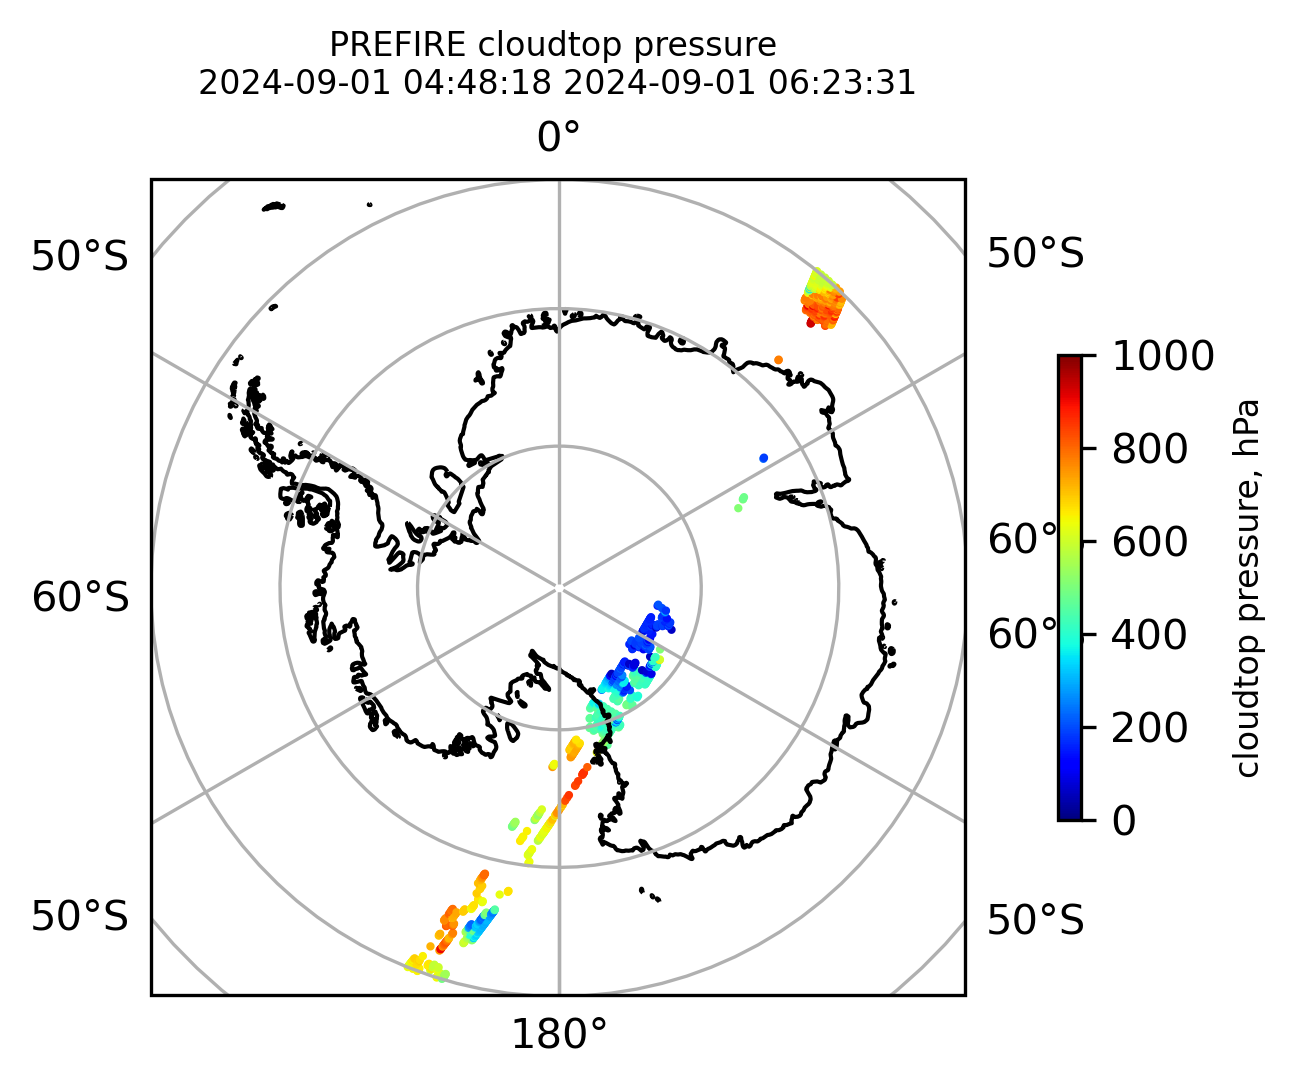
Plot the variables from the original granules
for name in PREFIRE_names:
(
ctime_orig,
ctime_minus_UTC_orig,
lat_orig,
lon_orig,
time_UTC_orig,
bitQF_orig,
cloud_d_eff_orig,
fv_cloud_d_eff_orig,
cloud_tau_orig,
fv_cloud_tau_orig,
cloudtop_pressure_orig,
fv_cloudtop_pressure_orig,
) = read_PREFIRE_2B_CLD(name)
# find valid beginning and ending times in the slice
for time in time_UTC_orig[:, :]:
if time[0] == -9999:
continue
beginning_time_array = time
break
for time in time_UTC_orig[-1::-1, :]:
if time[0] == -9999:
continue
ending_time_array = time
break
beginning_time = f"{beginning_time_array[0]:4d}-{beginning_time_array[1]:02d}-{beginning_time_array[2]:02d} {beginning_time_array[3]:02d}:{beginning_time_array[4]:02d}:{beginning_time_array[5]:02d}"
ending_time = f"{ending_time_array[0]:4d}-{ending_time_array[1]:02d}-{ending_time_array[2]:02d} {ending_time_array[3]:02d}:{ending_time_array[4]:02d}:{ending_time_array[5]:02d}"
beginning_time_fn = f"{beginning_time_array[0]:4d}{beginning_time_array[1]:02d}{beginning_time_array[2]:02d}T{beginning_time_array[3]:02d}{beginning_time_array[4]:02d}{beginning_time_array[5]:02d}"
ending_time_fn = f"{ending_time_array[0]:4d}{ending_time_array[1]:02d}{ending_time_array[2]:02d}T{ending_time_array[3]:02d}{ending_time_array[4]:02d}{ending_time_array[5]:02d}"
mask_cloud_d_eff = (cloud_d_eff_orig[:, :] != fv_cloud_d_eff) & (bitQF_orig[:, :] == 0)
mask_cloud_tau = (cloud_tau_orig[:, :] != fv_cloud_tau) & (bitQF_orig[:, :] == 0)
mask_cloudtop_pressure = (cloudtop_pressure_orig[:, :] != fv_cloudtop_pressure) & (
bitQF_orig[:, :] == 0
)
valid_cloud_d_eff = cloud_d_eff_orig[mask_cloud_d_eff]
valid_cloud_d_eff_lat = lat_orig[mask_cloud_d_eff]
valid_cloud_d_eff_lon = lon_orig[mask_cloud_d_eff]
valid_cloud_tau = cloud_tau_orig[mask_cloud_tau]
valid_cloud_tau_lat = lat_orig[mask_cloud_tau]
valid_cloud_tau_lon = lon_orig[mask_cloud_tau]
valid_cloudtop_pressure = cloudtop_pressure_orig[mask_cloudtop_pressure]
valid_cloudtop_pressure_lat = lat_orig[mask_cloudtop_pressure]
valid_cloudtop_pressure_lon = lon_orig[mask_cloudtop_pressure]
# Plot arrays in orthografic projection
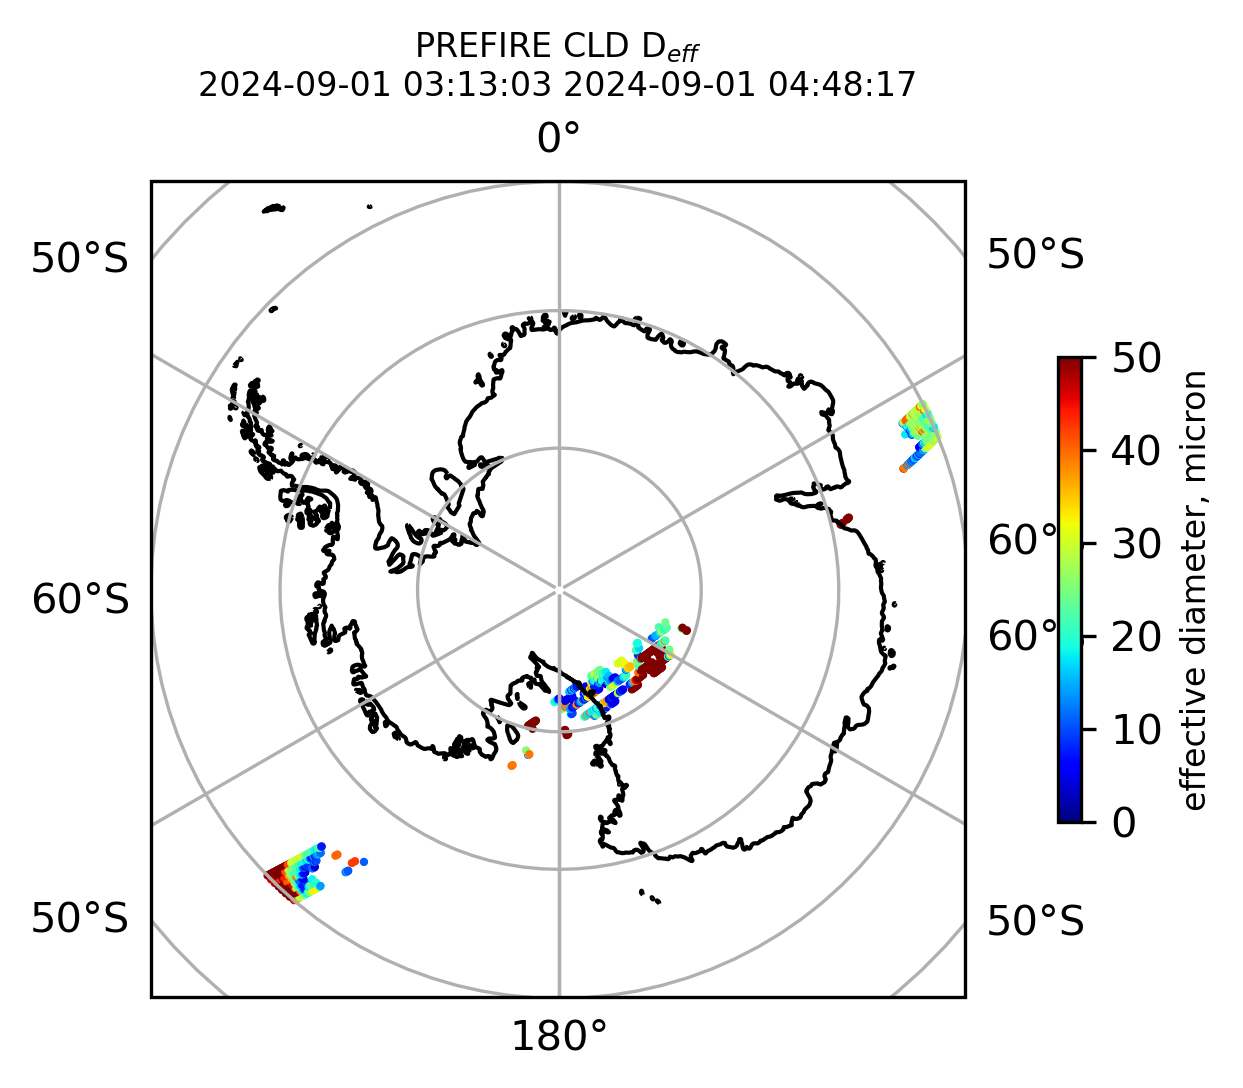
if len(valid_cloud_d_eff) > 0:
fig = plt.figure(figsize=(4, 4), dpi=300, facecolor=None)
proj = ccrs.Orthographic(central_longitude=0.0, central_latitude=-90.0, globe=None)
transform = ccrs.PlateCarree()
ax1 = fig.add_subplot(111, projection=proj)
ax1.set_extent([0.0, 360.0, -90.0, -60.0], crs=transform)
im1 = ax1.scatter(
valid_cloud_d_eff_lon,
valid_cloud_d_eff_lat,
c=valid_cloud_d_eff,
s=1.0,
cmap=plt.cm.jet,
vmin=0.0,
vmax=50.0,
transform=transform,
)
ax1.coastlines(resolution="50m", color="black", linewidth=1)
gl = ax1.gridlines(draw_labels=True, dms=True)
gl.xlabels_top = False
gl.ylabels_left = False
cb1 = plt.colorbar(
im1,
ticks=[0, 10.0, 20.0, 30.0, 40.0, 50.0],
fraction=0.025,
pad=0.1,
orientation="vertical",
)
cb1.set_label("effective diameter, micron", fontsize=8)
ax1.set_title("PREFIRE CLD D$_{eff}$ \n" + beginning_time + " " + ending_time, fontsize=8)
plt.savefig(
"PREFIRE_CLD_D_eff_SP_" + beginning_time_fn + "_" + ending_time_fn + ".png", dpi=600
)
plt.show()
plt.close()
else:
print(
f"there is nothing to plot for cloud effective diameter between {beginning_time} and {ending_time}"
)
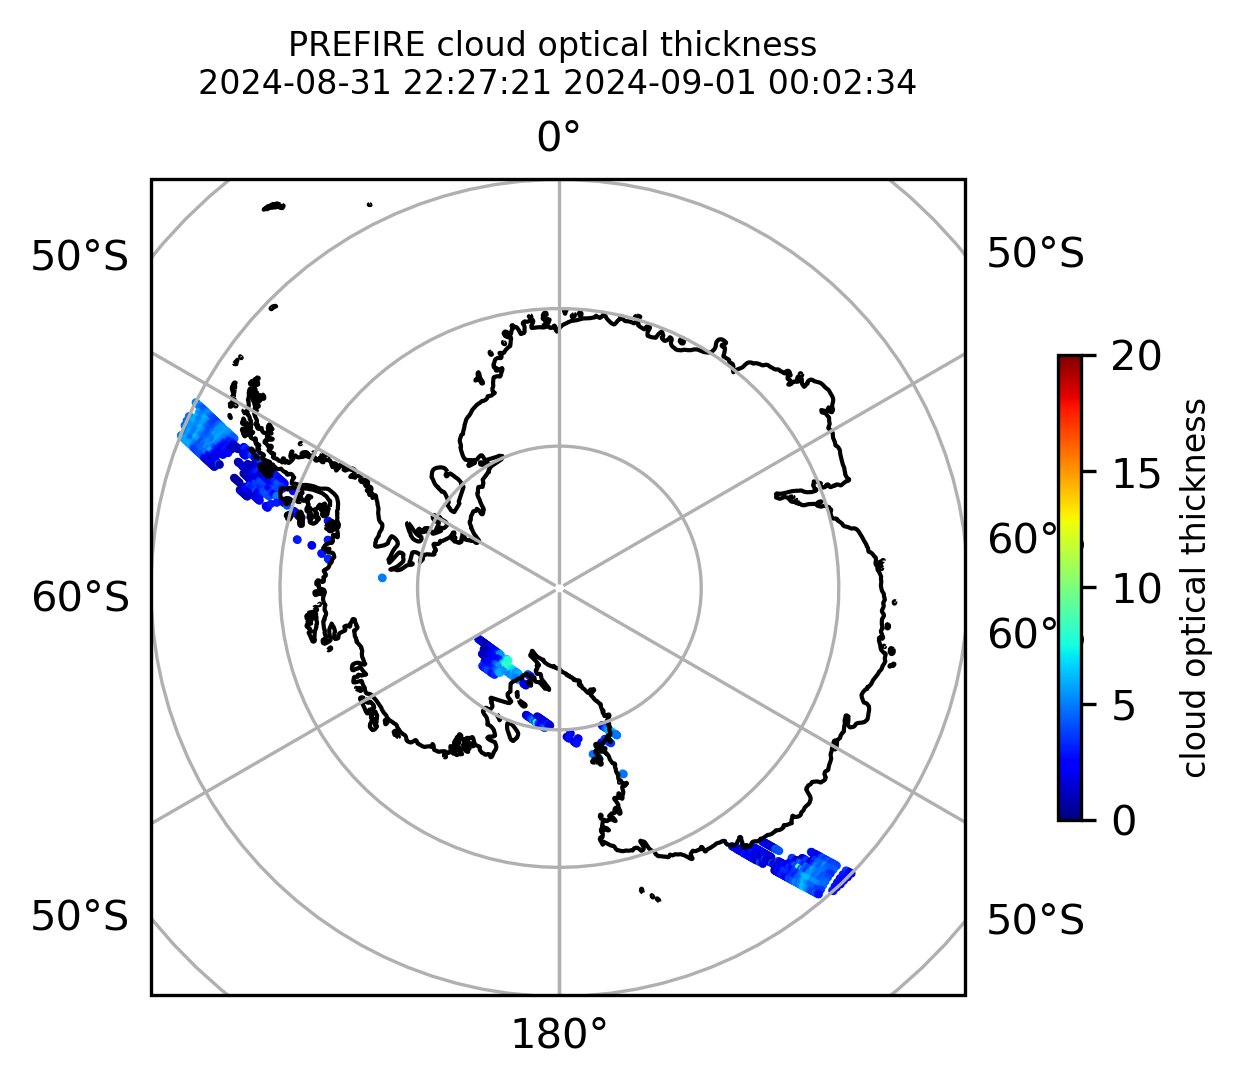
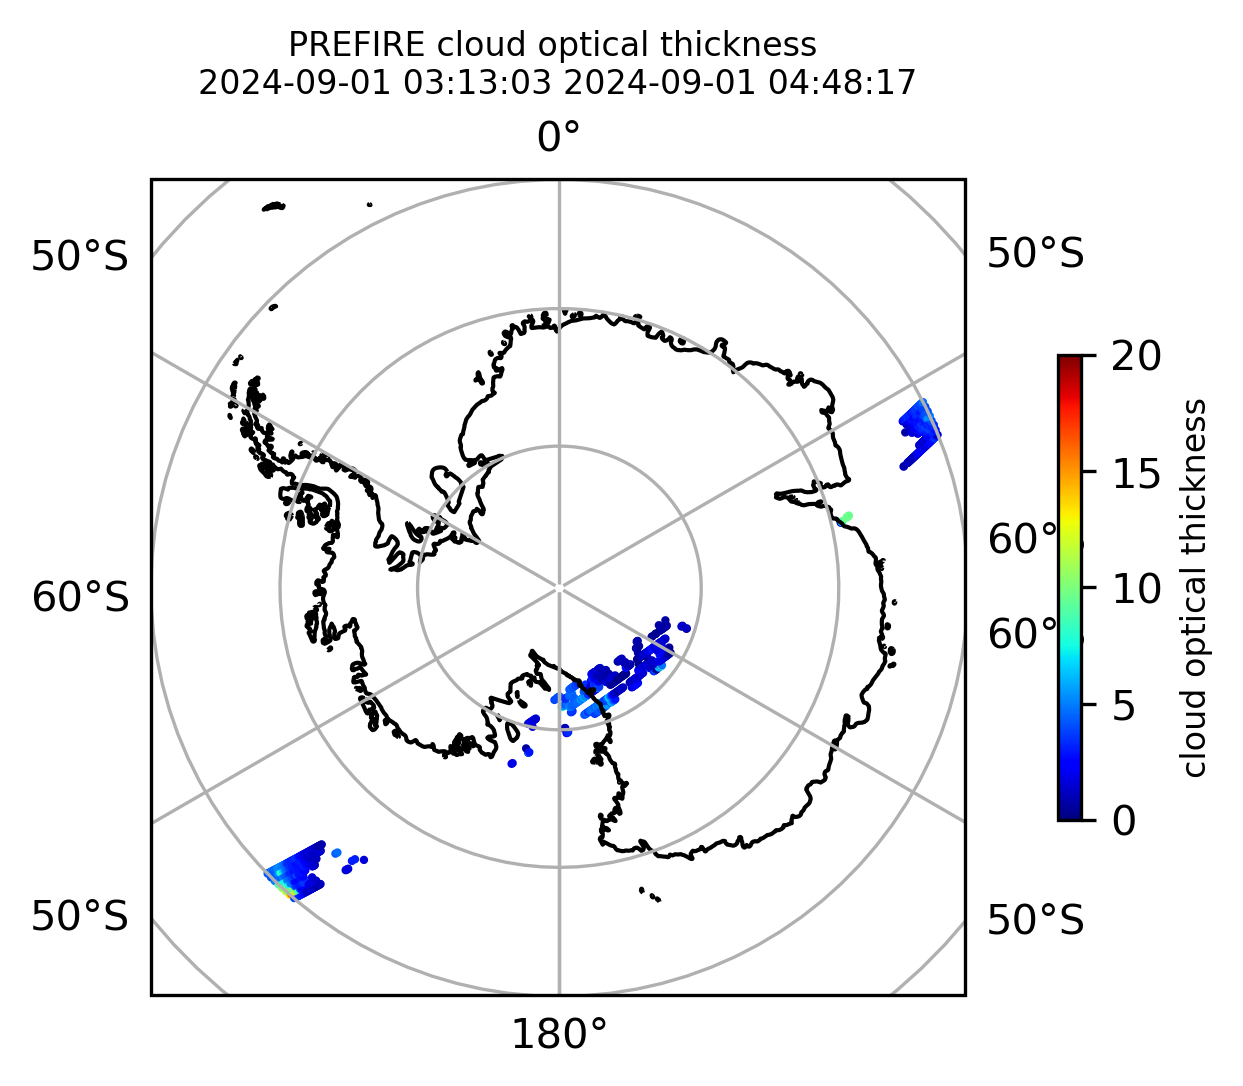
if len(valid_cloud_tau) > 0:
fig = plt.figure(figsize=(4, 4), dpi=300, facecolor=None)
proj = ccrs.Orthographic(central_longitude=0.0, central_latitude=-90.0, globe=None)
transform = ccrs.PlateCarree()
ax1 = fig.add_subplot(111, projection=proj)
ax1.set_extent([0.0, 360.0, -90.0, -60.0], crs=transform)
im1 = ax1.scatter(
valid_cloud_tau_lon,
valid_cloud_tau_lat,
c=valid_cloud_tau,
s=1.0,
cmap=plt.cm.jet,
vmin=0.0,
vmax=20.0,
transform=transform,
)
ax1.coastlines(resolution="50m", color="black", linewidth=1)
gl = ax1.gridlines(draw_labels=True, dms=True)
gl.xlabels_top = False
gl.ylabels_left = False
cb1 = plt.colorbar(
im1, ticks=[0, 5.0, 10.0, 15.0, 20.0], fraction=0.025, pad=0.1, orientation="vertical"
)
cb1.set_label("cloud optical thickness", fontsize=8)
ax1.set_title(
"PREFIRE cloud optical thickness \n" + beginning_time + " " + ending_time, fontsize=8
)
plt.savefig(
"PREFIRE_CLD_tau_SP_" + beginning_time_fn + "_" + ending_time_fn + ".png", dpi=600
)
plt.show()
plt.close()
else:
print(
f"there is nothing to plot for cloud optical thickness between {beginning_time} and {ending_time}"
)
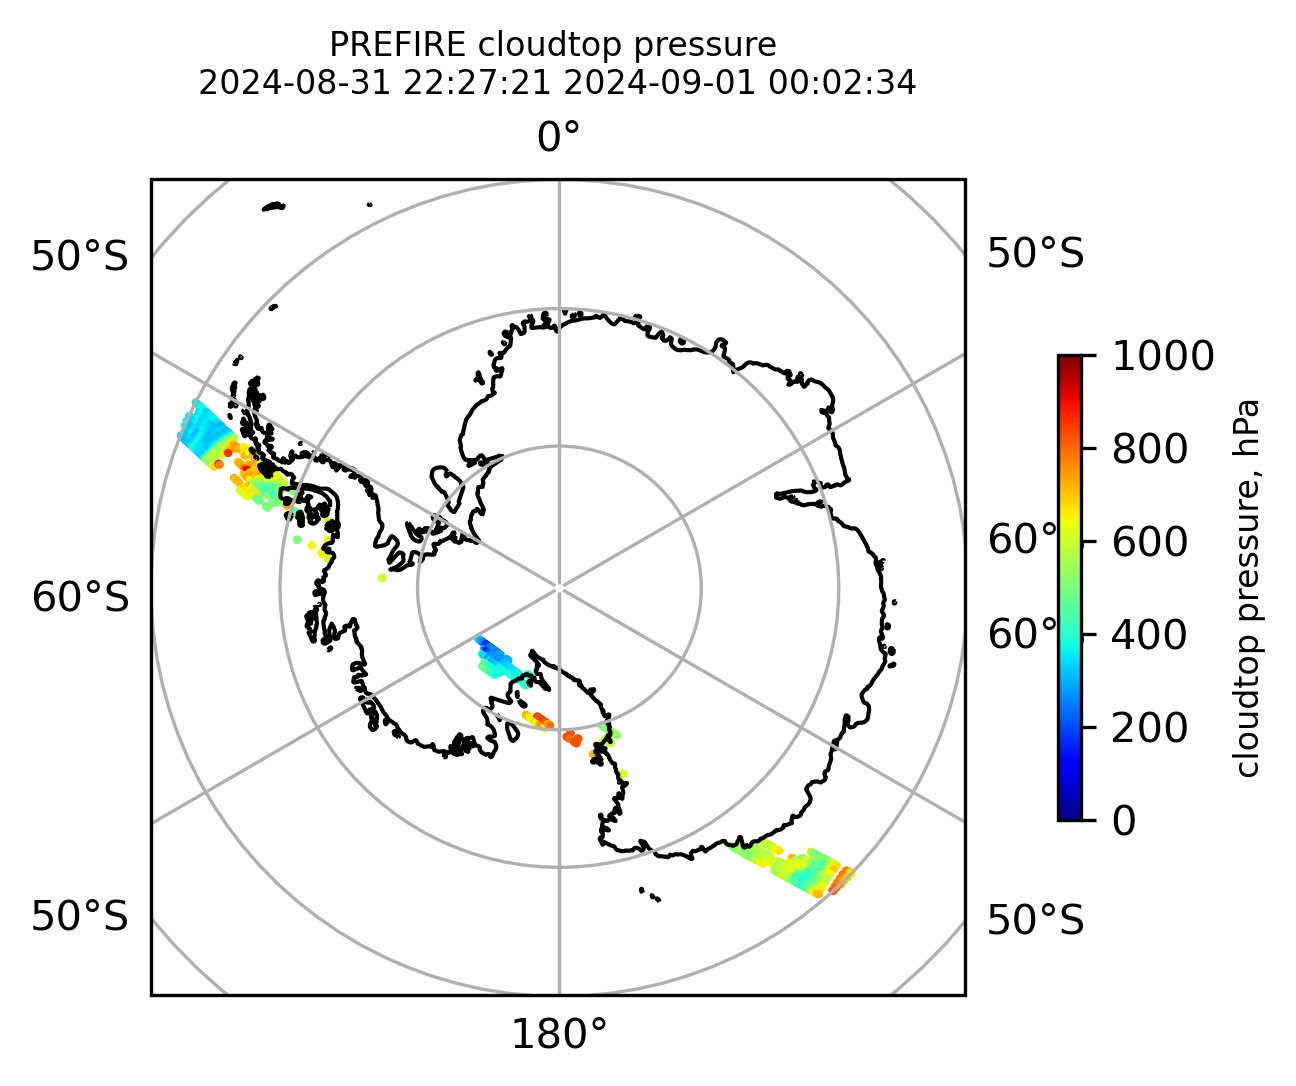
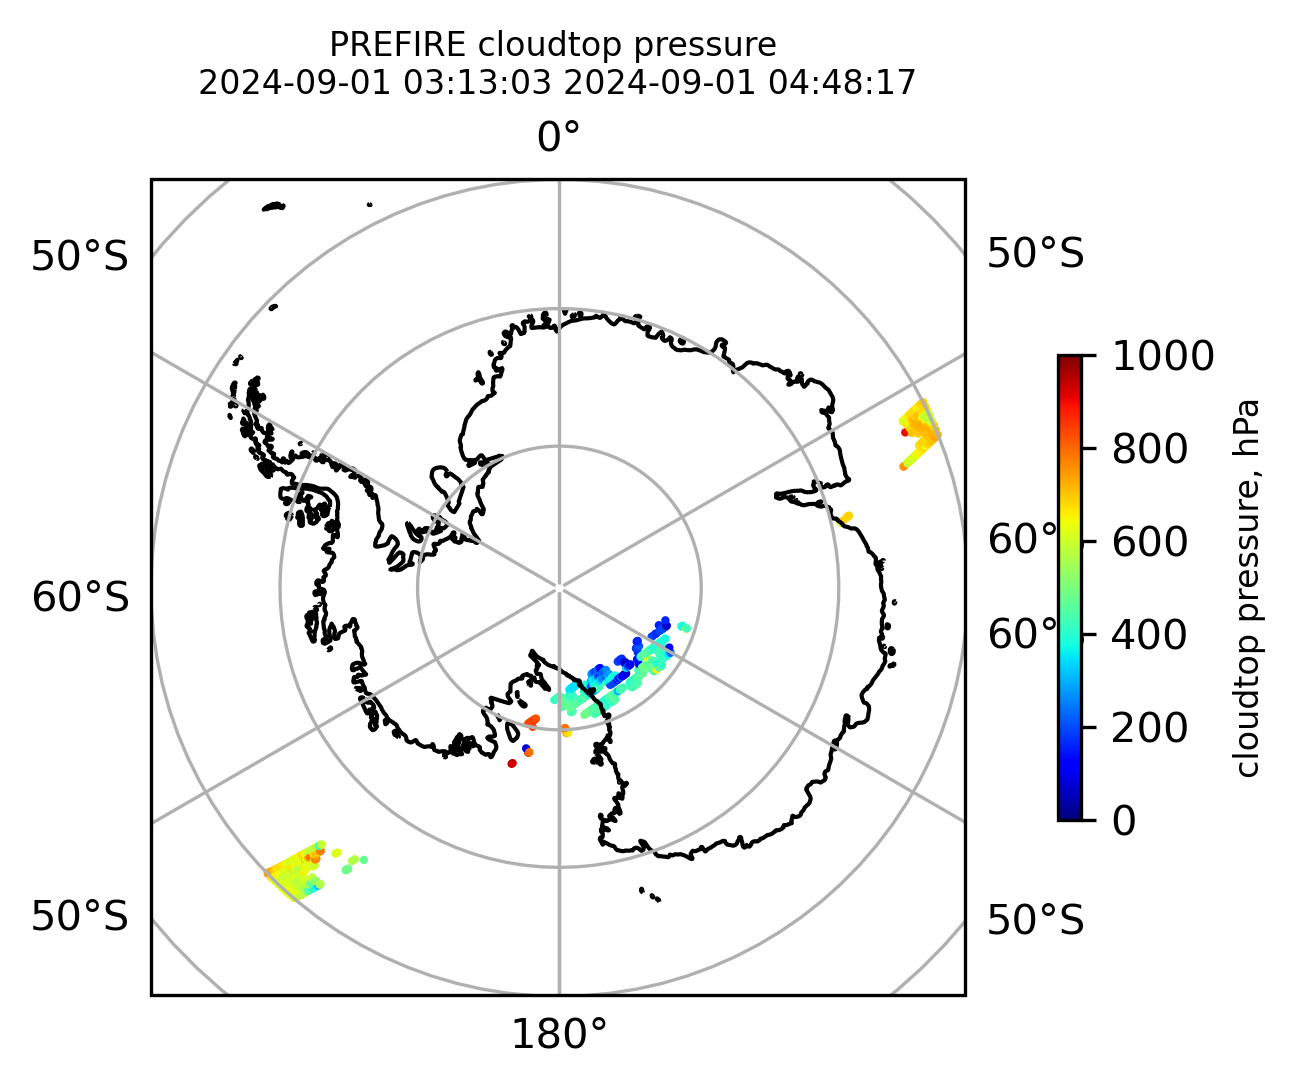
if len(valid_cloudtop_pressure) > 0:
fig = plt.figure(figsize=(4, 4), dpi=300, facecolor=None)
proj = ccrs.Orthographic(central_longitude=0.0, central_latitude=-90.0, globe=None)
transform = ccrs.PlateCarree()
ax1 = fig.add_subplot(111, projection=proj)
ax1.set_extent([0.0, 360.0, -90.0, -60.0], crs=transform)
im1 = ax1.scatter(
valid_cloudtop_pressure_lon,
valid_cloudtop_pressure_lat,
c=valid_cloudtop_pressure,
s=1.0,
cmap=plt.cm.jet,
vmin=0.0,
vmax=1000.0,
transform=transform,
)
ax1.coastlines(resolution="50m", color="black", linewidth=1)
gl = ax1.gridlines(draw_labels=True, dms=True)
gl.xlabels_top = False
gl.ylabels_left = False
cb1 = plt.colorbar(
im1,
ticks=[0, 200.0, 400.0, 600.0, 800.0, 1000.0],
fraction=0.025,
pad=0.1,
orientation="vertical",
)
cb1.set_label("cloudtop pressure, hPa", fontsize=8)
ax1.set_title(
"PREFIRE cloudtop pressure \n" + beginning_time + " " + ending_time, fontsize=8
)
plt.savefig(
"PREFIRE_CLDTOP_pressure_SP_" + beginning_time_fn + "_" + ending_time_fn + ".png",
dpi=600,
)
plt.show()
plt.close()
else:
print(
f"there is nothing to plot for cloudtop pressure between {beginning_time} and {ending_time}"
)