The OCI instrument is a hyperspectral imaging radiometer, collecting hyperspectral measurements from 340 nm - 895 nm (Ultra Violet (UV) to near-infrared-NIR), and multi-spectral measurements from 940-2260 nm (NIR to shortwave-infrared).
# Import required librariesimport csvimport mathfrom io import BytesIOimport cf_xarrayimport earthaccessimport rasterio as rioimport xarray as xrimport cartopyimport numpy as npimport pandas as pdimport matplotlib.pyplot as pltimport holoviews as hvimport geoviews as gvimport hvplot.xarray
Authentication
earthaccess creates and leverages Earthdata Login tokens to authenticate with NASA systems. Earthdata Login tokens expire after a month. To retrieve a token from Earthdata Login, you can either enter your username and password each time you use earthaccess, or use a .netrc file. A .netrc file is a configuration file that is commonly used to store login credentials for remote systems. If you don’t have a .netrc or don’t know if you have one or not, you can use the persist argument with the login function below to create or update an existing one, then use it for authentication.
If you do not have an Earthdata Account, you can create one here.
auth = earthaccess.login(persist=True)
Searching for Collections
The PACE mission produces several collections or datasets available via the NASA Earthdata cloud archive.
To view what’s available, we can use the search_datasets function and with the keyword argument.
If you print the collections object you can explore all of the json metadata.
# # Print collections# collections
We can also create a list of the short-name, concept-id, and version of each result collection using list comprehension. These fields are important for specifying and searching for data within collections.
collections_info = [ {'short_name': c['umm']['ShortName'],'collection_concept_id': c['meta']['concept-id'],'version': c['umm']['Version'],'entry_title': c['umm']['EntryTitle'] }for c in collections]pd.set_option('display.max_colwidth', 150)collections_info = pd.DataFrame(collections_info)collections_info
short_name
collection_concept_id
version
entry_title
0
PACE_OCI_L2_SFREFL
C3620139902-OB_CLOUD
3.1
PACE OCI Level-2 Regional Surface Reflectance Data, version 3.1
1
PACE_OCI_L3M_SFREFL
C3620140468-OB_CLOUD
3.1
PACE OCI Level-3 Global Mapped Surface Reflectance Data, version 3.1
2
PACE_OCI_L2_SFREFL_NRT
C3620139865-OB_CLOUD
3.1
PACE OCI Level-2 Regional Surface Reflectance - Near Real-time (NRT) Data, version 3.1
3
PACE_OCI_L3B_SFREFL
C3620140190-OB_CLOUD
3.1
PACE OCI Level-3 Global Binned Surface Reflectance Data, version 3.1
4
PACE_OCI_L3B_SFREFL_NRT
C3620140174-OB_CLOUD
3.1
PACE OCI Level-3 Global Binned Surface Reflectance - Near Real-time (NRT) Data, version 3.1
...
...
...
...
...
69
PACE_SPEXONE_L2_MAPOL_OCEAN_NRT
C4126583180-OB_CLOUD
4.0
PACE SPEXone Level-2 Regional Aerosol Over Ocean Optical Properties, FastMAPOL Algorithm - Near Real-time (NRT) Data, version 4.0
70
PVST_AIRSHARP
C3394587427-OB_DAAC
0
Airborne asSessment of Hyperspectral Aerosol optical depth and water-leaving Reflectance Product Performance for PACE
71
PACE-PAX_Ivanpah-Playa_Data
C3525273524-LARC_CLOUD
1
PACE-PAX Ivanpah Playa Data
72
AirSHARP_MetNav_AircraftInSitu_CIRPAS-TO_Data
C4126792971-LARC_CLOUD
1
AirSHARP CIRPAS Twin Otter In-Situ Meteorology and Navigation Data
73
ARCTAS_AircraftRemoteSensing_P3B_CAR_Data
C3228971208-LARC_CLOUD
1
ARCTAS P-3B Aircraft CAR Data
74 rows × 4 columns
The collection concept-id is the best way to search for data within a collection, as this is unique to each collection. The short-name can be used as well, however the version should be passed as well as there can be multiple versions available with the same short name. After finding the collection you want to search, you can use the concept-id to search for granules within that collection.
Searching for Granules
A granule can be thought of as a unique spatiotemporal grouping within a collection. To search for granules, we can use the search_data function from earthaccess and provide the arguments for our search. Its possible to specify search products using several criteria shown in the table below:
dataset origin and location
spatio temporal parameters
dataset metadata parameters
archive_center
bounding_box
concept_id
data_center
temporal
entry_title
daac
point
granule_name
provider
polygon
version
cloud_hosted
line
short_name
For this example we will search for the PACE OCI Level-2 Regional Surface Reflectance Data using a bounding box and temporal parameters, and add a cloud_cover parameter. Note that not all datasets have cloud cover information, so this parameter may not work for all datasets.
C:\Users\ebolch\AppData\Local\miniforge3\envs\lpdaac_vitals\Lib\site-packages\earthaccess\results.py:348: FutureWarning: As of version 1.0, `DataGranule.size` will be accessed as an attribute; e.g. use `DataCollection.size` **not** `DataCollection.size()`
  self["size"] = self.size()
Results is a list, so we can use an index to view a single result.
results[0]
C:\Users\ebolch\AppData\Local\miniforge3\envs\lpdaac_vitals\Lib\site-packages\earthaccess\results.py:375: FutureWarning: As of version 1.0, `DataGranule.size` will be accessed as an attribute; e.g. use `DataCollection.size` **not** `DataCollection.size()`
  Size(MB): {self.size()}
C:\Users\ebolch\AppData\Local\miniforge3\envs\lpdaac_vitals\Lib\site-packages\earthaccess\formatters.py:40: FutureWarning: As of version 1.0, `DataGranule.size` will be accessed as an attribute; e.g. use `DataCollection.size` **not** `DataCollection.size()`
  granule_size = round(granule.size(), 2)
To access data from NASA, you’ll need to provide your Earthdata Login credentials. When streaming this can best be done using the token or cookies set up by the earthaccess library. Since we’ve already logged in, we can start an fsspec session to manage our connection to a remote file, including sending credentials. This allows other libraries to work with a URL as if it is a local file.
In addition to fsspec for this example, we’ll also use BytesIO to read the full dataset into memory. This is not always the best approach, but for working with a single PACE scene which is ~750 mb, it speeds up the process due to the data structure and some caveats regarding fsspec.
fs = earthaccess.get_fsspec_https_session()
Now, open the connection to the remote file and read into memory.
with fs.open(links[0]) as f:
    file_content = BytesIO(f.read())
Reading dataset
The PACE_OCI_L2_SFREFL files are heirarchichal netCDF files, so we will use the xarray.datatree function to read in and view all of the groups. Using the datatree representation object, we can explore the data structure, which is useful for understanding the groups, variables, dimension order, and coordinates.
Pope, R.M. and Fry, E.S., 1997, "Absorption spectrum (380-700 nm) of pure water. II. Integrating cavity measurements," Appl. Opt.,36, 8710-8723.; Kou, L., Labrie, D., Chylek, P., 1993, "Refractive indices of water and ice in the 0.65-2.5 m spectral range," Appl. Opt.,32, 3531-3540 (1993).
[286 values with dtype=float32]
bbw
(number_of_reflective_bands)
float32
...
long_name :
Band-pass averaged backscattering coefficient for seawater
Zhang, X., Hu, L., and He, M.-X. (2009). Scattering by pure seawater: effect of salinity, Opt. Express 17(7)
comment :
These are nominal values for a salinity of 38.4 at 20 degrees C. The bbw values used in the processing are corrected for temperature and salinity on a per pixel basis.
[286 values with dtype=float32]
k_oz
(number_of_reflective_bands)
float32
...
long_name :
Ozone Absorption cross-sections
units :
cm^-1
valid_min :
0.0
valid_max :
0.1
reference :
Anderson, S.M., Morton, J., and Mauersberger, K. "Near-infrared absorption spectra of 16O3 and 18O3: Adiabatic energy of the 1A2 state?." The Journal of Chemical Physics 93.6 (1990): 3826-3832.; Anderson, Stuart M., Maeder, J., and Mauersberger, K. "Effect of isotopic substitution on the visible absorption spectrum of ozone." The Journal of chemical physics 94.10 (1991): 6351-6357; http://dx.doi.org/10.1029/92GL00780; http://dx.doi.org/10.1029/93GL01765; http://dx.doi.org/10.1029/93GL02311
comment :
Computed at 229.15K with code provided by E.P.Shettle, NRL, Washington, DC; Based on the measurements of: S.Anderson et al. and J. Burkholder and Talukdar (1994)
[286 values with dtype=float32]
k_no2
(number_of_reflective_bands)
float32
...
long_name :
NO2 Absorption cross-sections
units :
cm^2 molecule^-1
valid_min :
0.0
valid_max :
0.1
reference :
K. Bogumil, et al., "Measurements of molecular absorption spectra with the SCIAMACHY pre-flight model: Instrument characterization and reference data for atmospheric remote sensing in the 230-2380 nm region," J. Photochem. Photobiol. A.: Photochem. 157, 167-184 (2003).; W. Schneider,et al., "Absorption cross-sections of NO2 in the UV and visible region (200 - 700 nm) at 298 K", J. Photochem. Photobiol. 40, 195-217 (1987)
[286 values with dtype=float32]
Tau_r
(number_of_reflective_bands)
float32
...
long_name :
Rayleigh Optical Thickness
valid_min :
0.0
valid_max :
0.5
reference :
Bodhaine, B.A., Wood, N.B, Dutton, E.G., Slusser, J.R. (1999). On Rayleigh Optical Depth Calculations, J. Atmos. Ocean Tech., 16, 1854-1861.
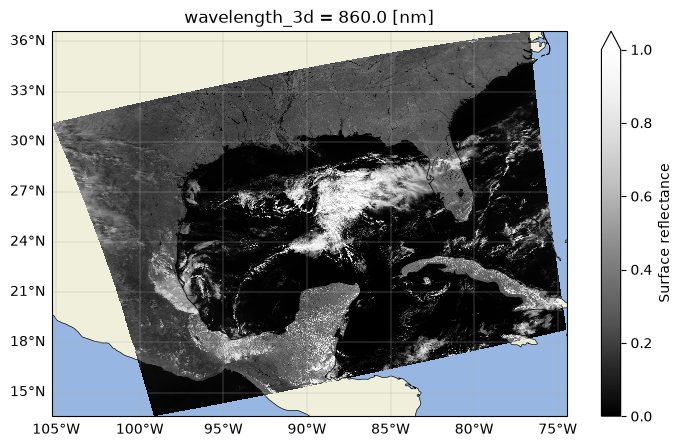
It will be easier to work with the data if we create a single dataset, which we can do by merging the data and coordinate variables we need from different groups. Longitude and latitude appear as data variables, in the group navigation_data, they need to be explicitly set as coordinates. Note the group geophysical_data and its data variables: rhos and l2_flags. The rhos variable are surface reflectances, and the l2_flags are quality flags as defined by the Ocean Biology Processing Group (OBPG).
Note that “wavelength_3d” is an indexed coordinate, which allows us to subset the dataset by slicing or choosing individual wavelengths. The method=“nearest” argument lets us select one wavelength without knowning its exact value.
Hence, we can select one wavelength even if it does not represent an exact value in the “wavelength_3d” array and plot it using the method=“nearest” argument.
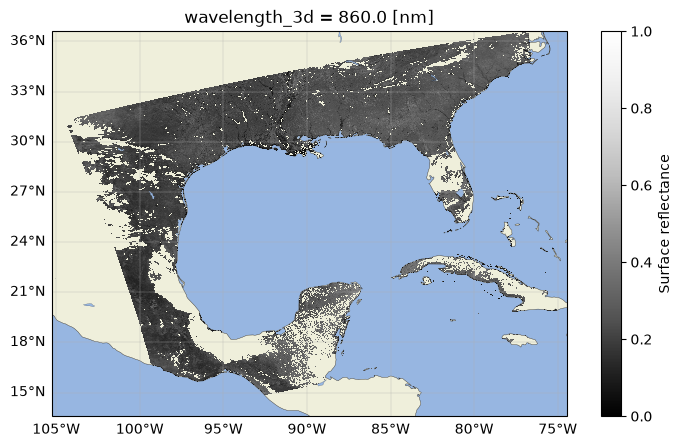
From viewing the data structure, we can see that the data is in swath format based on the dimensions. This means that we will need to grid the data to work with it in a typical manner.
There are a couple ways to do this transformation, but for this example, we’ll opt for a simple approach using rioxarray. Note that the process shown here will create a grid unique to this scene, so it won’t easily merge or stack with others created in the same way for something like a time-series analysis.
We encourage you to check the following resources for additional information on data transformation for PACE datasets: SeaDAS and Python Jupyter notebook
To grid the data with rioxarray, we need to change the order of the dimensions in the array. Hyperspectral data is often stored (y,x,band) since most processing is conducted along the band dimension; however, rioxarray expects the dimensions to be in the order of (band, y, x), so we must transpose the array to grid the data using rioxarray. Note that we’ll also want to ensure we’re using nearest neighbor resampling to preserve the spectral information during the gridding process. If we use another method we could be creating artificial spectra which could lead to inaccurate unmixing or classification results.
From this point, we can either subset the data spatially to a smaller region of interest, or extract a series of location points to work with.
Interactive Spatial and Spectral Plots
Combining the Spatial and Spectral information into a single visualization can be a powerful tool for exploring and inspecting imaging spectroscopy data. Using the streams module from Holoviews we can link a spatial map to a plot of spectra.
We could plot a single band image as we previously have, but using a multiband image, like an RGB may help infer what targets we’re examining. Build function to select and adjust the brightness of bands to create a nice RGB image.
Select bands to represent red (650 nm), green (560 nm), and blue (470 nm) by finding the nearest to a wavelength chosen to represent that color.
To get a better rgb image, we can balance the brightness of the selected wavelengths to make a prettier map. This will not affect the data, just the visuals. To do this we will use the function below. We can change the bright argument to increase or decrease the brightness of the scene as a whole.
def gamma_adjust(rgb_da, bright=0.3):""" Adjust gamma across all bands in the RGB dataset. """ array = rgb_da.data# Mask nan and negative values invalid = np.isnan(array) | (array <0) valid =~invalid# Calculate gamma based on the mean of valid values mean_valid = np.nanmean(array[valid]) gamma = math.log(bright) / math.log(mean_valid)# Apply scaling and clip scaled = np.full_like(array, np.nan) scaled[valid] = np.power(array[valid], gamma) rgb_da.data = np.clip(scaled, 0, 1)return rgb_da
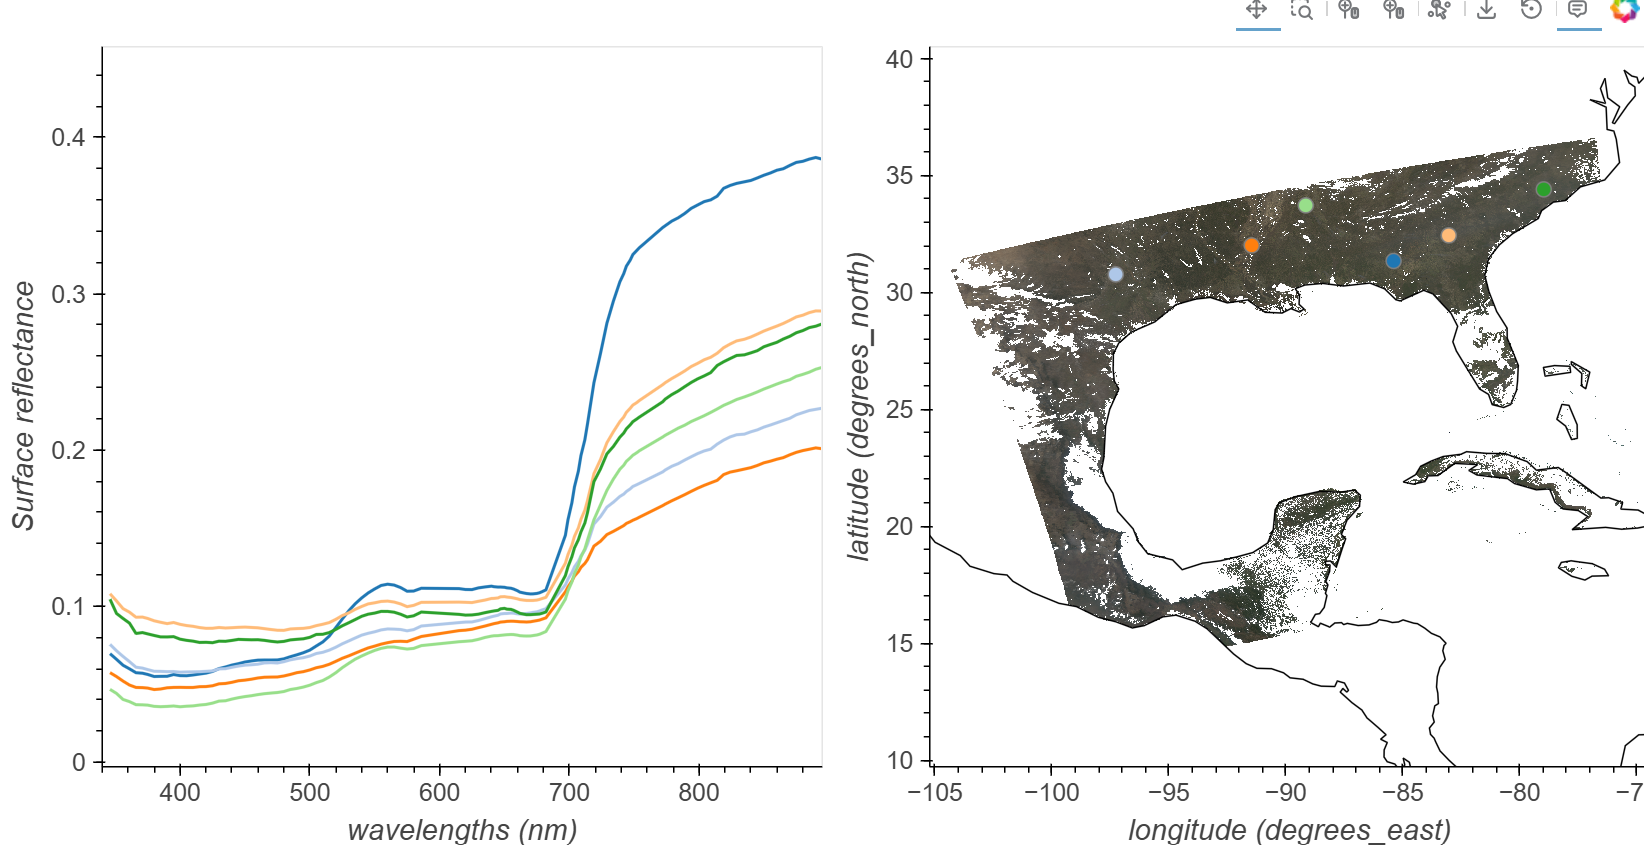
Now that we have an RGB dataset, we can use that to create a spatial plot, and data selected by clicking on our rgb map, which can be inputs for a function to return values from the full dataset at the selected latitude and longitude location using the cell below. To visualize the spectral and spatial data side-by-side, we use the Point Draw tool from the holoviews library.
Click in the RGB image to add spectra to the plot. You can also click and hold the mouse button then drag previously placed points. To remove a point click and hold the mouse button down, then press the backspace key.
# Starting Point from center pixelx_start =-85.3879y_start =31.3446# Set Point LimitPOINT_LIMIT =10# Set up Color Cyclingcolor_cycle = hv.Cycle('Category20')first_point = ([x_start], [y_start], [0])points = gv.Points(first_point, kdims=['longitude','latitude'], vdims='id', crs=cartopy.crs.PlateCarree())points_stream = hv.streams.PointDraw( data=points.columns(), source=points, drag=True, num_objects=POINT_LIMIT, styles={'fill_color': color_cycle.values[:POINT_LIMIT], 'line_color': 'gray'})# RGB Plot without Basemaprgb_map = rgb_da.hvplot.rgb(x='longitude', y='latitude', bands='wavelength_3d', frame_height=480, frame_width=480, crs=cartopy.crs.PlateCarree(), title="Stretched RGB PACE Image")# Coastlinescoastlines = gv.feature.coastline(projection=cartopy.crs.PlateCarree()).opts(line_color='black', line_width=1)posxy = hv.streams.PointerXY(source=rgb_map, x=x_start, y=y_start)clickxy = hv.streams.Tap(source=rgb_map, x=x_start, y=y_start)# Function to build spectral plot of clicked location to show on hover stream plotdef click_spectra(data): coordinates = [c for c inzip(data['longitude'], data['latitude'])] plots = {}for i, coords inenumerate(coordinates): x, y = coords selected = sr_dst.sel(longitude=x, latitude=y, method="nearest") plots[i] = ( selected.hvplot.line( y="rhos", x="wavelength_3d", xlim=(340, 895), #you can comment or change the range here to see the multispectral bands too label=f"{i}" ) ) points_stream.data["id"][i] = ireturn hv.NdOverlay(plots).opts(hv.opts.Curve(color=color_cycle))def hover_spectra(x,y):return sr_dst.sel(longitude=x,latitude=y,method='nearest').hvplot.line(y='rhos',x='wavelength_3d', color='black', frame_width=480)# Define the Dynamic Mapsclick_dmap = hv.DynamicMap(click_spectra, streams=[points_stream])hover_dmap = hv.DynamicMap(hover_spectra, streams=[posxy])# Plot the Map and Dynamic Map side by sidehv.Layout(hover_dmap*click_dmap + rgb_map * coastlines* points).cols(2).opts( hv.opts.Points(active_tools=['point_draw'], size=10, tools=['hover'], color='white', line_color='gray'), hv.opts.Overlay(show_legend=False, show_title=False, fontscale=1.5, frame_height=480))
We can take these selected points and the corresponding reflectance spectra and save them as a .csv for later use.
data = points_stream.datawavelengths = sr_dst.wavelength_3d.valuesrows = [["id", "longitude", "latitude"] + [str(i) for i in wavelengths]]for p inzip(data['longitude'], data['latitude'], data['id']): x, y, i = p spectra = sr_dst.sel(longitude=x, latitude=y, method="nearest").values row = [i, x, y] +list(spectra) rows.append(row)
withopen('../data/pace_interactive_plot_data.csv', 'w', newline='') as f: writer = csv.writer(f) writer.writerows(rows)
# In case you cannot save the file, check your directory# import os# print(os.getcwd())
Calculate unique indices
Hyperspectral-enabled Vegetation Indices (VI)
We’ll take the Chlorophyll Index Red Edge (CIRE) as an example of a hyperspectral-enabled VI. CIRE uses bands from the red edge and the NIR to get at relative canopy chlorophyll content.
CIRE: (ρ 800 /ρ 705)−1
Carotenoid Content Index (Car): [(1/ρ495)−(1/ρ705)] * ρ800
Information on Hyperspectral enabled indices by PACE here.
## Chlorophyll Index Red Edge (CIRE)# Select bandssr_800 = sr_dst.sel({"wavelength_3d": 800}, method="nearest")sr_705 = sr_dst.sel({"wavelength_3d": 705}, method="nearest")#Calculatecire = (sr_800 / sr_705) -1cire.attrs["long_name"] ="Chlorophyll Index Red Edge (CIRE)"