Cumulus Distribution Metrics
It is possible to configure Cumulus and the Cumulus Dashboard to display information about the successes and failures of requests for data. This requires the Cumulus instance to deliver Cloudwatch Logs and S3 Server Access logs to an ELK stack.
ESDIS Metrics in NGAP
Work with the ESDIS metrics team to set up permissions and access to forward Cloudwatch Logs to a shared AWS:Logs:Destination as well as transferring your S3 Server Access logs to a metrics team bucket.
The metrics team has taken care of setting up logstash to ingest the files that get delivered to their bucket into their Elasticsearch instance.
Once Cumulus has been configured to deliver Cloudwatch logs to the ESDIS Metrics team, you can use the Elasticsearch indexes to create the necessary target patterns on the dashboard. These are often <daac>-cloudwatch-cumulus-<env>-* and <daac>-distribution-<env>-*, but they will depend on your specific Elastiscearch setup.
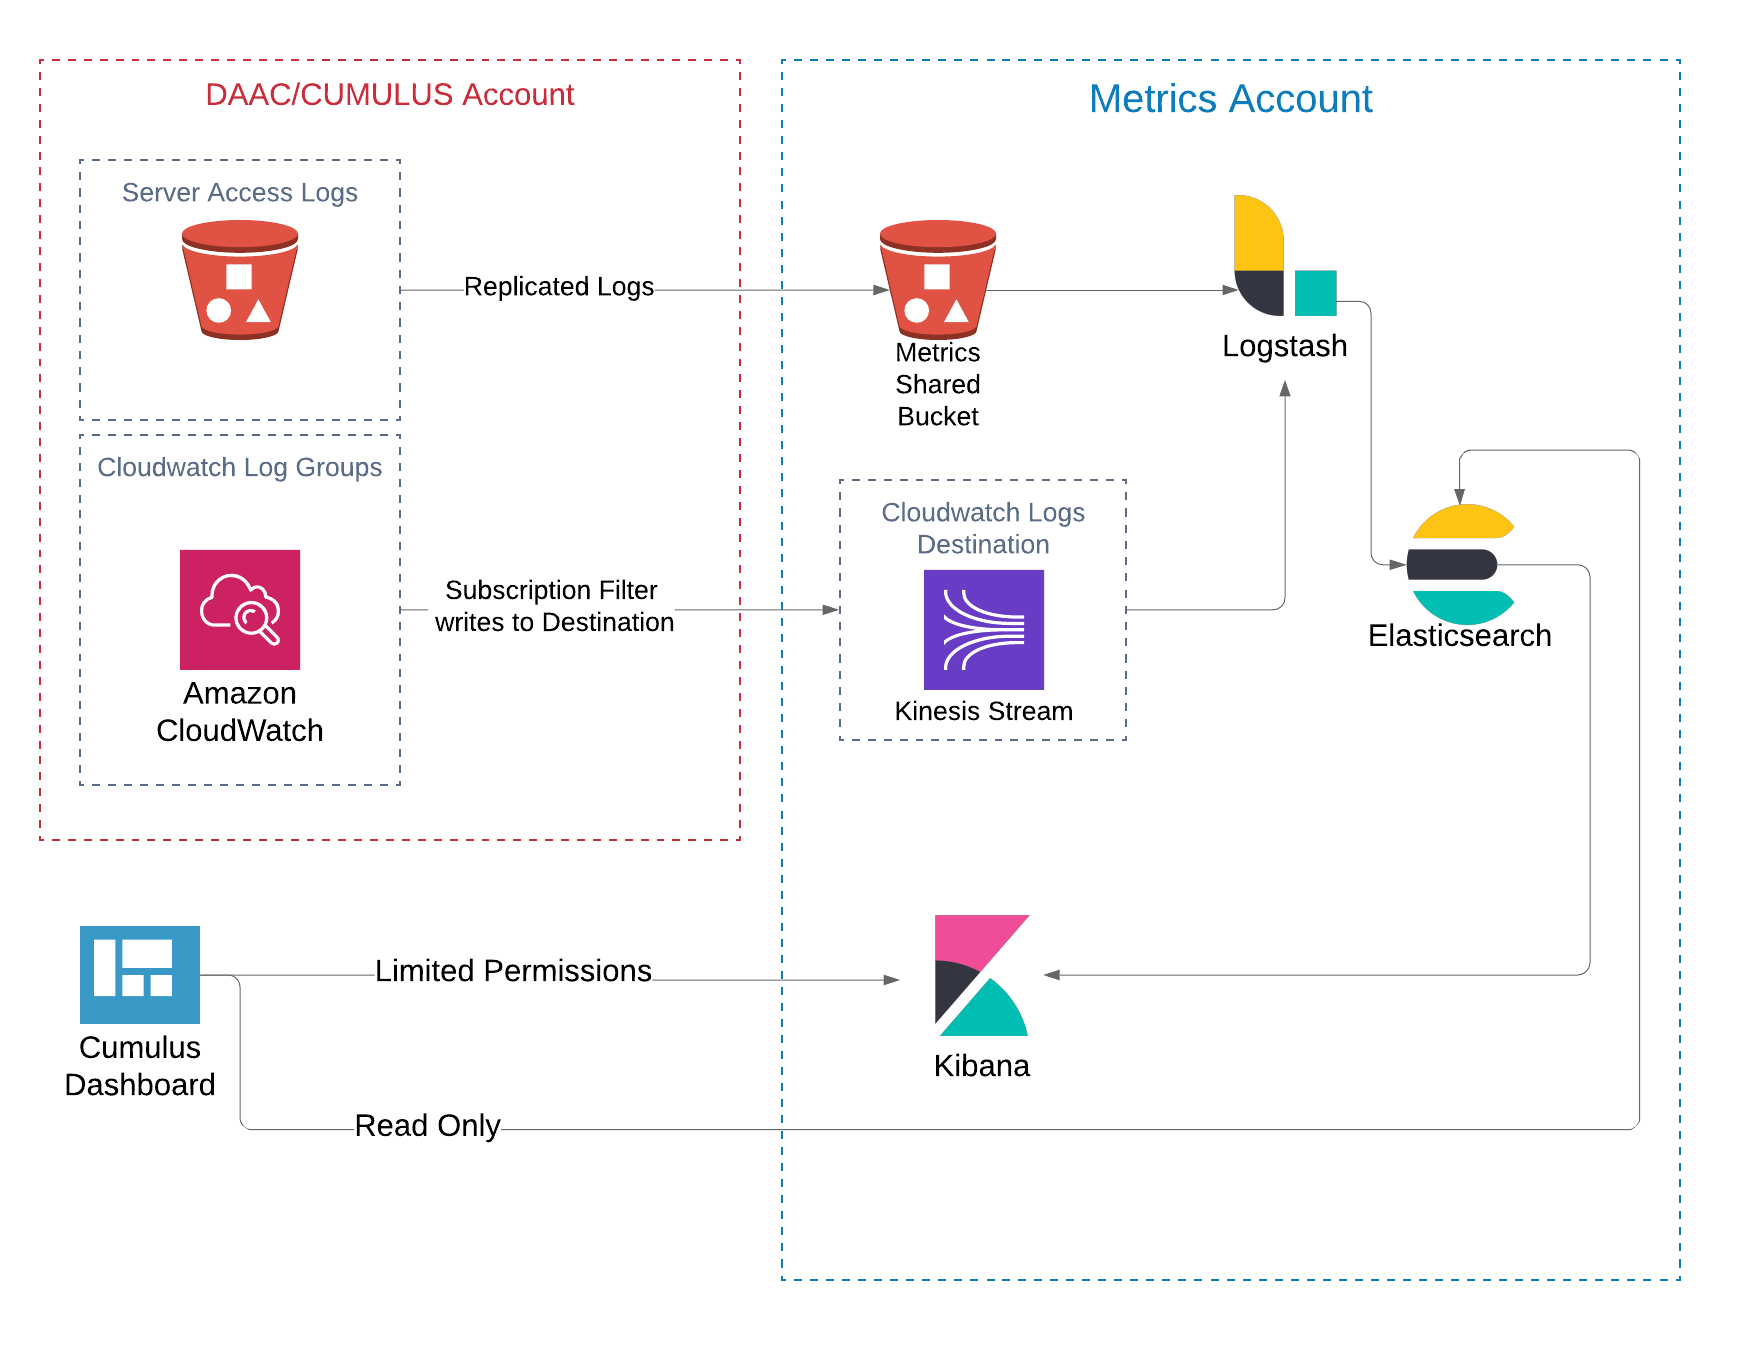
Cumulus / ESDIS Metrics distribution system