Cumulus Distribution Metrics
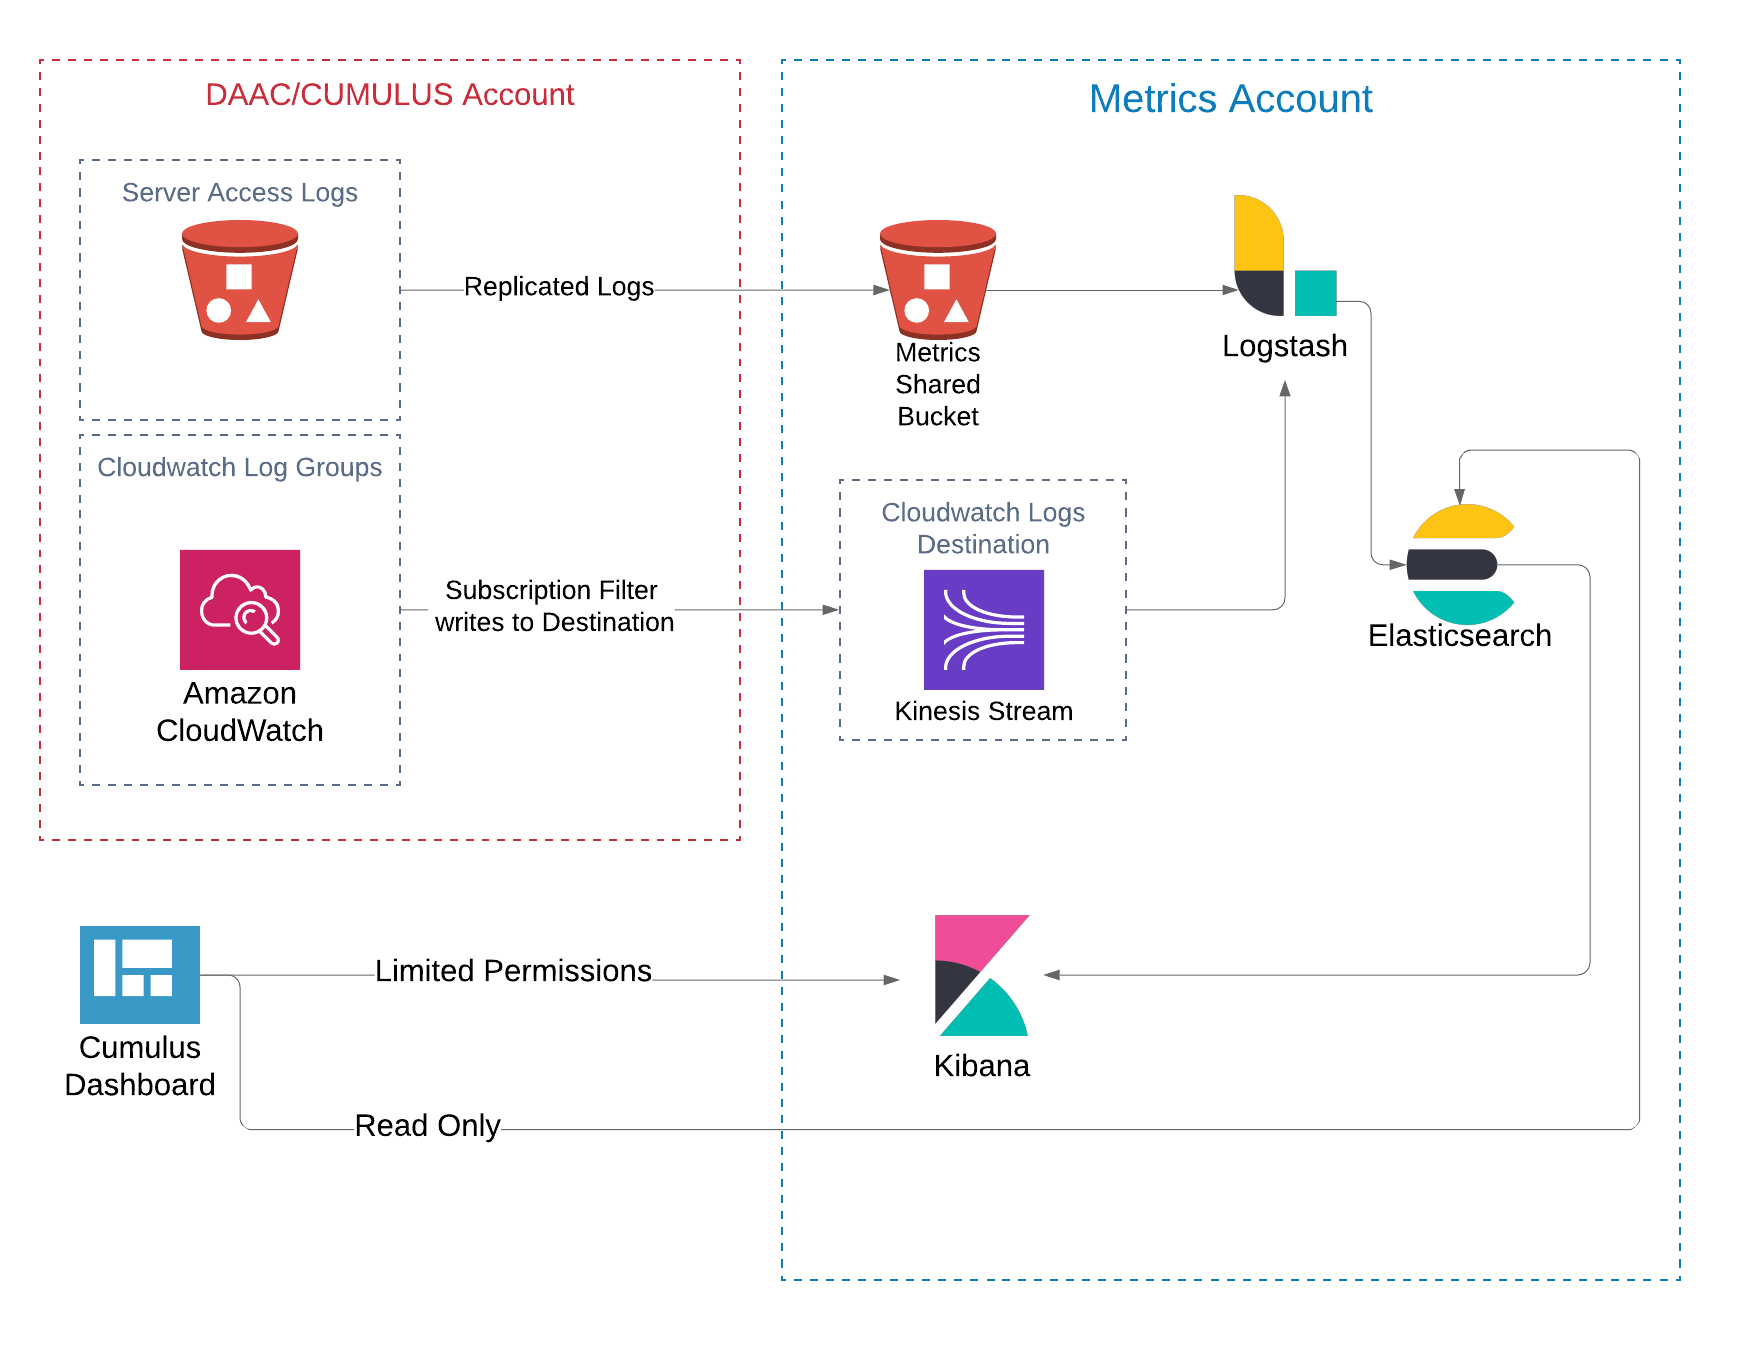
It is possible to configure Cumulus and the Cumulus Dashboard to display information about the successes and failures of requests for data. This requires the Cumulus instance to deliver Cloudwatch Logs and S3 Server Access logs to an ELK stack.
ESDIS Metrics in NGAP
Work with the ESDIS metrics team to set up permissions and access to forward Cloudwatch Logs to a shared AWS:Logs:Destination as well as transferring your S3 Server Access logs to a metrics team bucket.
The metrics team has taken care of setting up logstash to ingest the files that get delivered to their bucket into their Elasticsearch instance.
Once Cumulus has been configured to deliver Cloudwatch logs to the ESDIS Metrics team, you can create a Kibana index pattern associated with your Cumulus stack. The metrics team has worked out a convention with the Cumulus devlopers to ensure access to your stack's logs. The important piece is that the Kibana index pattern is created with the exact name of the prefix (stackName) with which cumulus was deployed.
Cumulus / ESDIS Metrics distribution system
Kibana Index
Before creating the Kibana index, verify that the Elasticsearch instance has been populated with at least one record1. Do this by visiting the Kibana endpoint and selecting Management, Elasticsearch Index Management and type the stack's prefix into the search bar. When you see an index with <prefix>-cloudwatch-YYY.MM.dd you are ready to continue. If you don't see at least one index for your stack, check to make sure you are delivering your logs to this Elasticsearch instance.
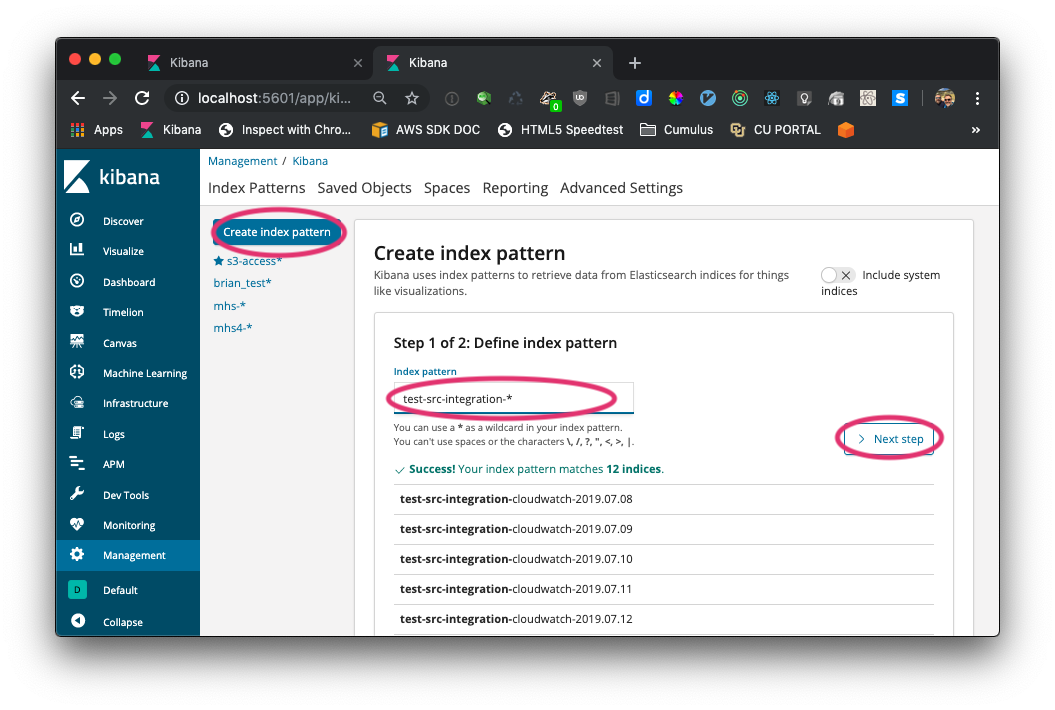
Step 1: create the index by selecting Management, Kibana Index Patterns. Use an index pattern of <prefix>-* and continue to the Next step.
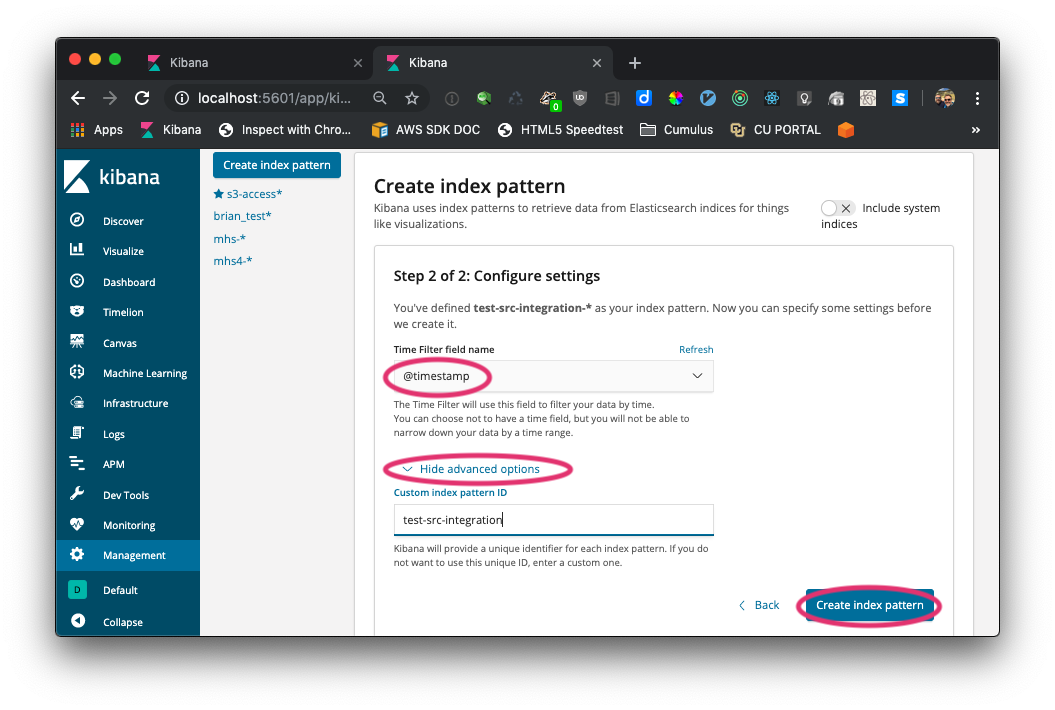
Step 2: Set the Time Filter field name to @timestamp with the pulldown option. Very importantly Show advanced options to create a Custom index Pattern ID that is your <prefix>. Then Create index pattern. This important convention allows the dashboard to know which index to use to find the distribution metrics for a particular stack.