Note
Go to the end to download the full example code.
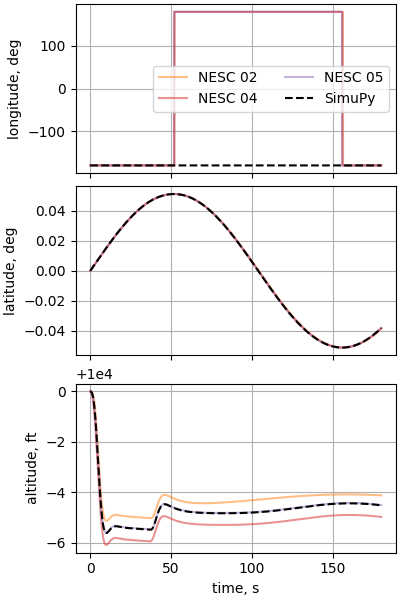
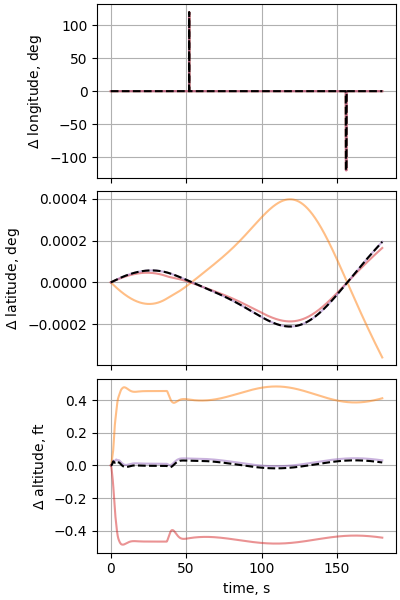
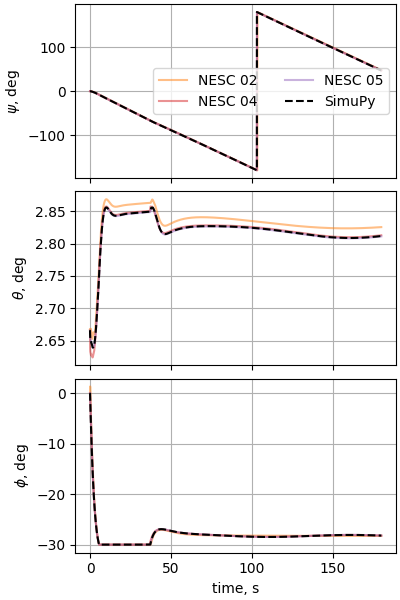
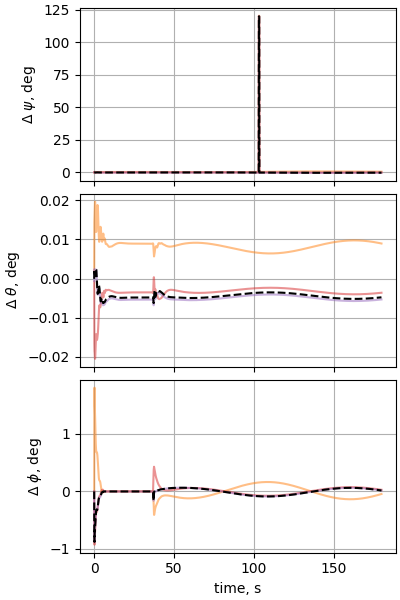
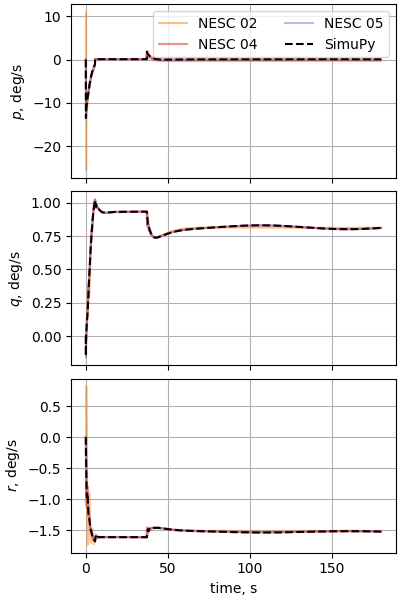
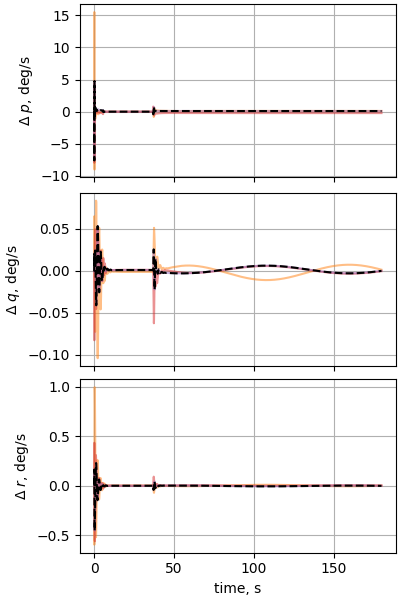
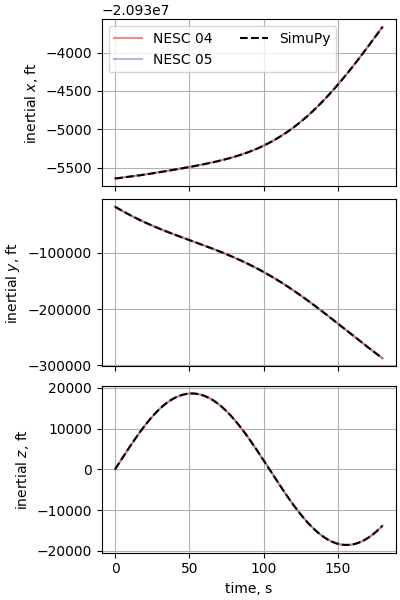
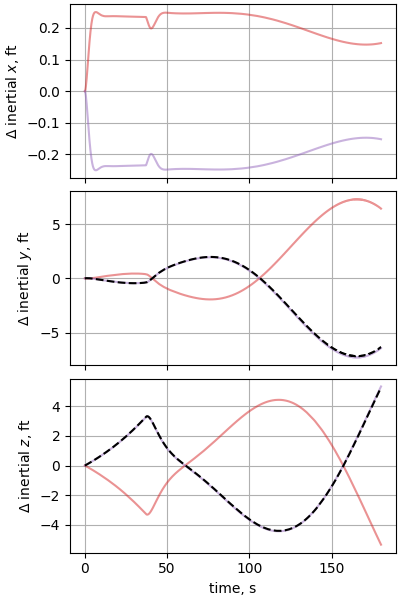
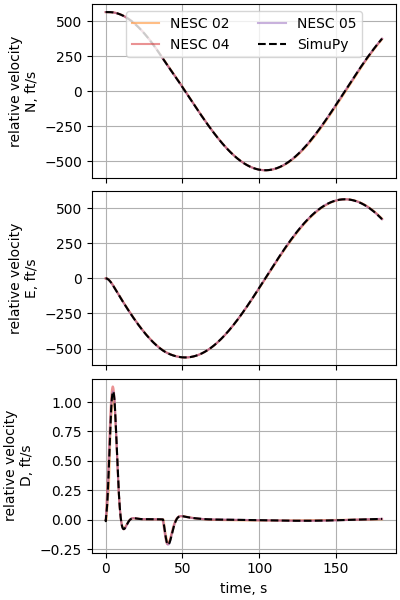
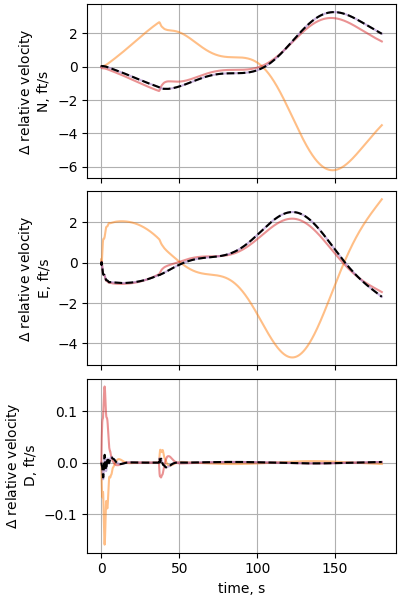
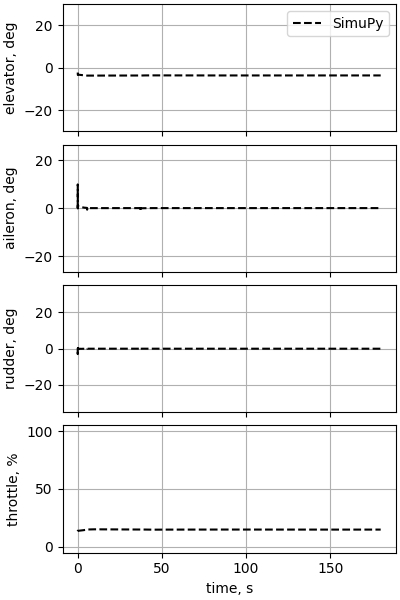
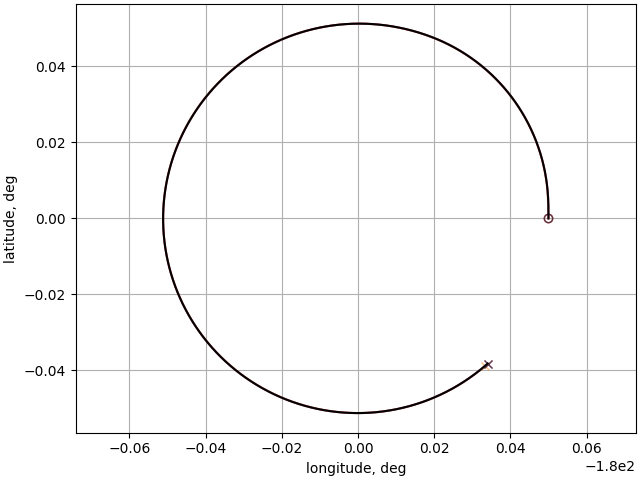
Case 16: Circular F-16 flight around Equator/dateline intersection
Verifies |
Sign changs in latitude and longitude |
Gravitation |
J2 |
Geodesy |
WGS-84 rotating |
Atmosphere |
US 1976 STD |
Winds |
still air |
Vehicle |
F-16 with circumnavigating auto-pilot |
Notes |
Initially straight & level and engage auto-pilot |
from simupy import systems
from simupy.block_diagram import BlockDiagram
import os
import numpy as np
from scipy import interpolate
import matplotlib.pyplot as plt

from nesc_testcase_helper import (
    get_baselines,
    nesc_options,
    plot_nesc_comparisons,
    plot_F16_controls,
    nesc_colors,
    benchmark,
)
from nesc_testcase_helper import ft_per_m

import F16_model
from F16_gnc import F16_gnc, trimmedKEAS

F16_vehicle = F16_model.F16()

from nesc_case11 import (
    BD,
    earth,
    rho_0,
    eval_trim,
    run_trimmer,
    knots_per_mps,
)
from nesc_case15 import (
    earth_output_for_gnc_select,
    dim_feedback,
    get_gnc_function,
    int_opts,
)

spec_ic_args = dict(
    phi_D=0.0 * np.pi / 180,  # latitude
    lamda_D=-179.95 * np.pi / 180,  # longitude
    h=10_000 / ft_per_m,
    V_N=563.643 / ft_per_m,
    V_E=0.0 / ft_per_m,
    V_D=0.0 / ft_per_m,
    psi=0.0 * np.pi / 180,
    theta=0.0 * np.pi / 180,
    phi=0.0 * np.pi / 180,
    p_B=0.0 * np.pi / 180,
    q_B=0.0 * np.pi / 180,
    r_B=0.0 * np.pi / 180,
)

opt_args, opt_ctrl = run_trimmer(
    spec_ic_args, throttle_ic=0.0, longStk_ic=0.0, allow_roll=False
)

trimmed_flight_condition = earth.ic_from_planetodetic(**opt_args)

trimmed_KEAS = (
    earth.output_equation_function(0, trimmed_flight_condition)[earth.V_T_idx]
    * np.sqrt(
        earth.output_equation_function(0, trimmed_flight_condition)[earth.rho_idx]
        / rho_0
    )
    * knots_per_mps
)


earth.initial_condition = trimmed_flight_condition

gnc_block = systems.SystemFromCallable(
    get_gnc_function(*opt_ctrl, keasCmd=trimmed_KEAS, circlePoleSW=False),
    dim_feedback,
    4,
)

BD = BlockDiagram(earth, F16_vehicle, gnc_block)
BD.connect(earth, F16_vehicle, inputs=np.arange(earth.dim_output))
BD.connect(F16_vehicle, earth, inputs=np.arange(F16_vehicle.dim_output))
BD.connect(
    gnc_block, F16_vehicle, inputs=np.arange(earth.dim_output, earth.dim_output + 4)
)
BD.connect(earth, gnc_block, outputs=earth_output_for_gnc_select)

with benchmark() as b:
    res = BD.simulate(180, integrator_options=int_opts)

plot_nesc_comparisons(res, "16")
plot_F16_controls(res, "16", y_idx_offset=0)
Optimization terminated successfully.
         Current function value: 0.000000
         Iterations: 281
         Function evaluations: 522
pitch: 2.6659e+00  roll: 0.0000e+00  longStk: 12.9899  throttle: 13.8207
accelerations:
 [[-7.73686670e-12  3.10714995e-12 -3.36115109e-12]
 [ 1.83141906e-11 -1.04603109e-12  1.45029217e-09]]
time to simulate: 281.716 s
plt.subplots(constrained_layout=True)
plt.axis("equal")

sim_lat = res.y[:, earth.phi_D_idx] * 180 / np.pi
sim_long = res.y[:, earth.lamda_D_idx] * 180 / np.pi

baseline_pds, baseline_pd_labels = get_baselines("16")

for baseline_idx, baseline_pd in enumerate(baseline_pds):
    baseline_long = (
        np.unwrap(2 * baseline_pd["longitude_deg"] * np.pi / 180) * 90 / np.pi
    )
    baseline_lat = baseline_pd["latitude_deg"].values
    plt.plot(
        baseline_long,
        baseline_lat,
        nesc_colors[baseline_pd_labels[baseline_idx]],
        alpha=0.5,
        label="NESC %s" % (baseline_pd_labels[baseline_idx]),
    )
    plt.plot(
        baseline_long[0],
        baseline_lat[0],
        "o",
        alpha=0.5,
        markerfacecolor="None",
        markeredgecolor=nesc_colors[baseline_pd_labels[baseline_idx]],
    )
    plt.plot(
        baseline_long[-1],
        baseline_lat[-1],
        "x",
        alpha=0.5,
        markerfacecolor="None",
        markeredgecolor=nesc_colors[baseline_pd_labels[baseline_idx]],
    )

plt.plot(sim_long, sim_lat, "k-", alpha=1.0)
plt.plot(
    sim_long[0], sim_lat[0], "o", alpha=0.5, markerfacecolor="None", markeredgecolor="k"
)
plt.plot(
    sim_long[-1],
    sim_lat[-1],
    "x",
    alpha=0.5,
    markerfacecolor="None",
    markeredgecolor="k",
)

plt.xlabel("longitude, deg")
plt.ylabel("latitude, deg")
plt.grid(True)

if nesc_options["interactive_mode"]:
    plt.show()
else:
    plt.savefig(os.path.join(nesc_options["save_relative_path"], "16_groundtrack.pdf"))
Total running time of the script: (4 minutes 47.611 seconds)