LaTeX Graphics
Overview
Graphics within LaTeX may be generated using portable graphics format (PGF) and TikZ command layers (Wiki Link). Although the syntax can be complex at times, it offers a very powerful method for generating portable graphics directly within the LaTeX document.
Example Simple Axis
% Import TikZ library for customizing arrow heads
% i.e. an arrow head may be scaled in width/height via: -{Latex[length=2mm,width=2mm]}
\usetikzlibrary{arrows.meta}

\begin{tikzpicture}
    \draw[-{Latex[scale=1.25]}] (0,0) -- (1,0)  node [right] {$x$};
    \draw[-{Latex[scale=1.25]}] (0,0) -- (0,1)  node [above] {$y$};
\end{tikzpicture}

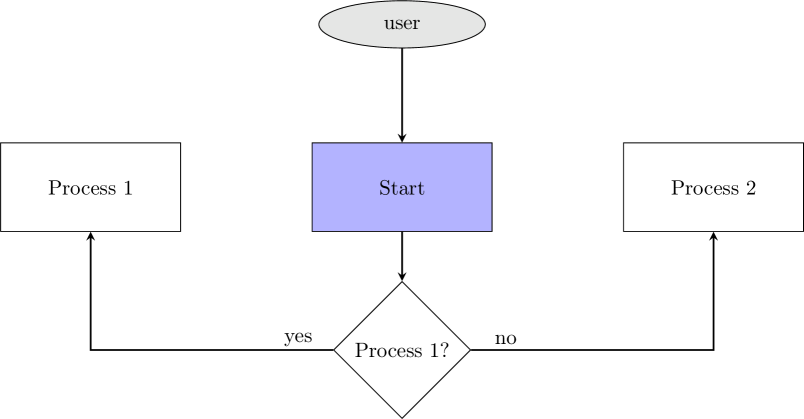
Example Flow Diagram
% Import required TikZ libraries
\usetikzlibrary{shapes,shadows,arrows}

% Define some reusable styles
\tikzstyle{decision} = [diamond, draw, fill=white]
\tikzstyle{line} = [draw, -stealth, thick]
\tikzstyle{elli}=[draw, ellipse, fill=gray!20, minimum height=8mm, text width=5em, text centered]
\tikzstyle{block} = [draw, rectangle, fill=white, text width=8em, text centered, minimum height=15mm, node distance=10em]

\begin{tikzpicture}
    % Create Blocks
    \node [block,fill=blue!30!white] (start) {Start};
    \node [block, left of=start, xshift=-5em] (process1) {Process 1};
    \node [elli, above of=start, yshift=5em] (user) {user};
    \node [block, right of=start, xshift=5em] (process2) {Process 2};
    \node[decision, below of=start, yshift=-5em](decision1){Process 1?};
    % Add Arrows
    \path [line] (user) -- (start);
    \path [line] (start) -- (decision1);
    \path [line] (decision1) -| node[yshift=0.5em, xshift=10em] {yes} (process1);
    \path [line] (decision1) -| node[yshift=0.5em, xshift=-10em] {no} (process2);
\end{tikzpicture}
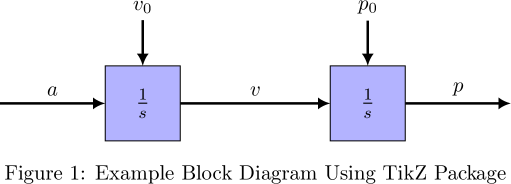
Example Block Diagram
% Define a common style for blocks - this style is labeled "myBlock"
\tikzstyle{myBlock}=[draw, fill=blue!30!white, minimum size=0.5in, node distance=1.5in]

% Import required TikZ libraries
\usetikzlibrary{arrows.meta}

% Define common style for path lines - this style is labeled "myPath"
\tikzstyle{myPath} = [-{Latex[length=2mm,width=2mm]}, line width=0.4mm]

\begin{figure}[H]
\centering
\begin{tikzpicture}
   % Draw initial node denoted by "v" label
   \node[myBlock] (v) {\large$\frac{1}{s}$};
   % Draw second node, "p" label, with location relative to node "a"
   \node[myBlock] (p) [right of=v] {\large$\frac{1}{s}$};

   % Draw initial condition inputs with labels "v0" and "p0"
   \node (v0) [above of=v, yshift=0.25in] {$v_0$};
   \node (p0) [above of=p, yshift=0.25in] {$p_0$};

   % Draw lines from initial conditions to blocks
   \draw[myPath] (v0) -- (v);
   \draw[myPath] (p0) -- (p);

   % Draw line between each of the blocks
   \draw[myPath] (v) -- (p) node [midway, above] {$v$};

   % Create dummy nodes to with no content
   \node[node distance=1in] (dummy_v) [left of=v] {};
   \node[node distance=1in] (dummy_p) [right of=p] {};

   % Draw lines from dummy nodes to blocks
   \draw[myPath] (dummy_v) -- (v) node [midway, above] {$a$};
   \draw[myPath] (p) -- (dummy_p) node [midway, above] {$p$};
\end{tikzpicture}
\caption{Example Block Diagram Using TikZ Package}
\label{fig:block_diagram}
\end{figure}