Advanced Plotting Routines
This notebook tutorial shows special customized visualization options that can be utilized for some model output or data type.
SatPlot4D
This tool enables many customizations for timeseries output along a satellite trajectory. It is designed to work with FlyThrough output or more generalized datasets.
from kamodo_ccmc.flythrough.plots import SatPlot4D
help(SatPlot4D)
Help on function SatPlot4D in module kamodo_ccmc.flythrough.plots:
SatPlot4D(var, time, c1, c2, c3, vard, varu, inCoordName, inCoordType, plotCoord, groupby, model, displayplot=True, returnfig=False, type='3D', body='black', zoom=False, divfile='', htmlfile='', plotCoordType1D='car', vUnit='', vxName='', vx='', vyName='', vy='', vzName='', vz='', vScale=1.0, vSkip=0)
4D plotting for satellite trajectories using plotly by Darren De Zeeuw
__Required variables__
var: string of variable name
time: time formatted as a timestamp in UTC
c1: latitude or X
c2: longitude or Y
c3: altitude or Z
vard: data of variable var, same size array as positions
varu: string of variable var units
inCoordName: string for incoming coordinate system.
GDZ, GEO, GSM, GSE, SM, GEI, MAG, RLL
inCoordType: string for incoming coordinate type. car, sph
plotCoord: string for coordinate system used in 3D plot.
Assumes car for 3D and Polar, sph otherwise.
groupby: grouping of data for animation, values include
all, day, hour, minute, N, orbitE, orbitM
model: string of name of model the data was extracted from
__Optional variables__
displayplot: logical to show/hide displayed plot
returnfig: logical to return figure object for further modification,
will override displayplot if True
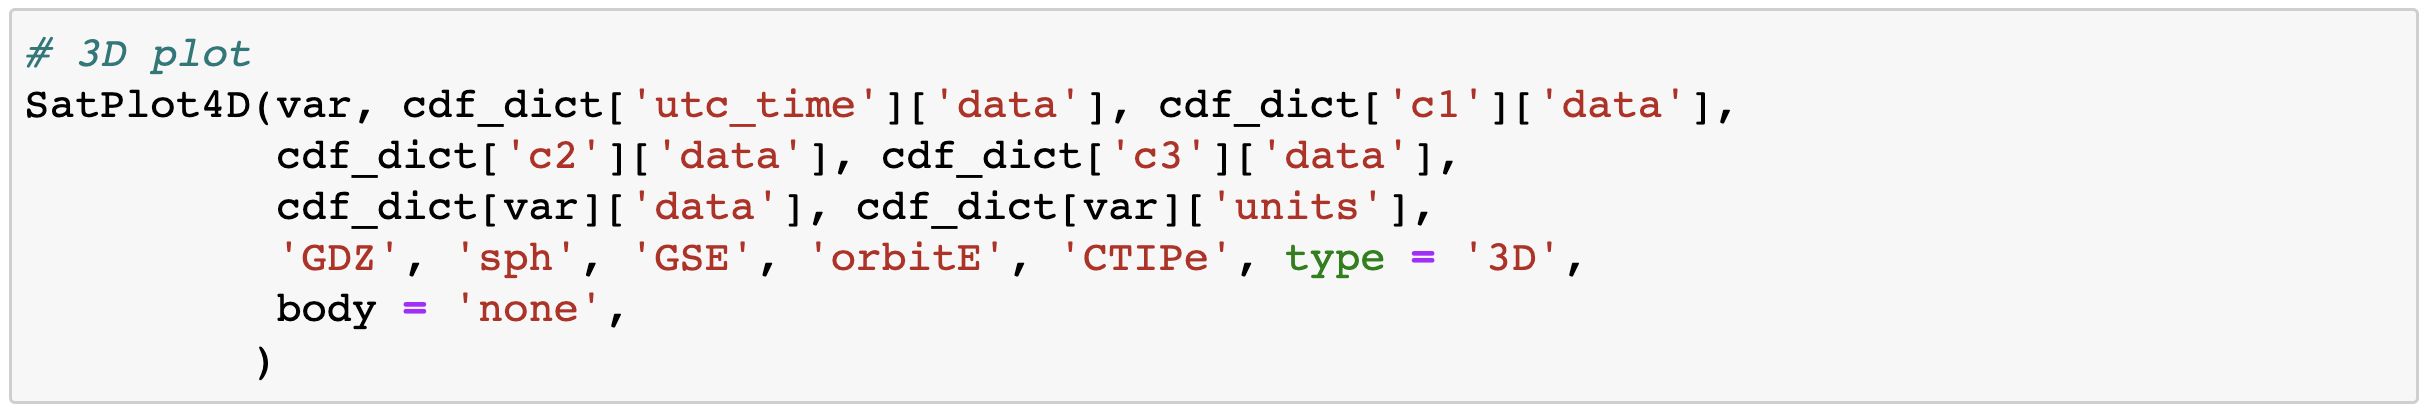
type: string for choice of plot type, values:
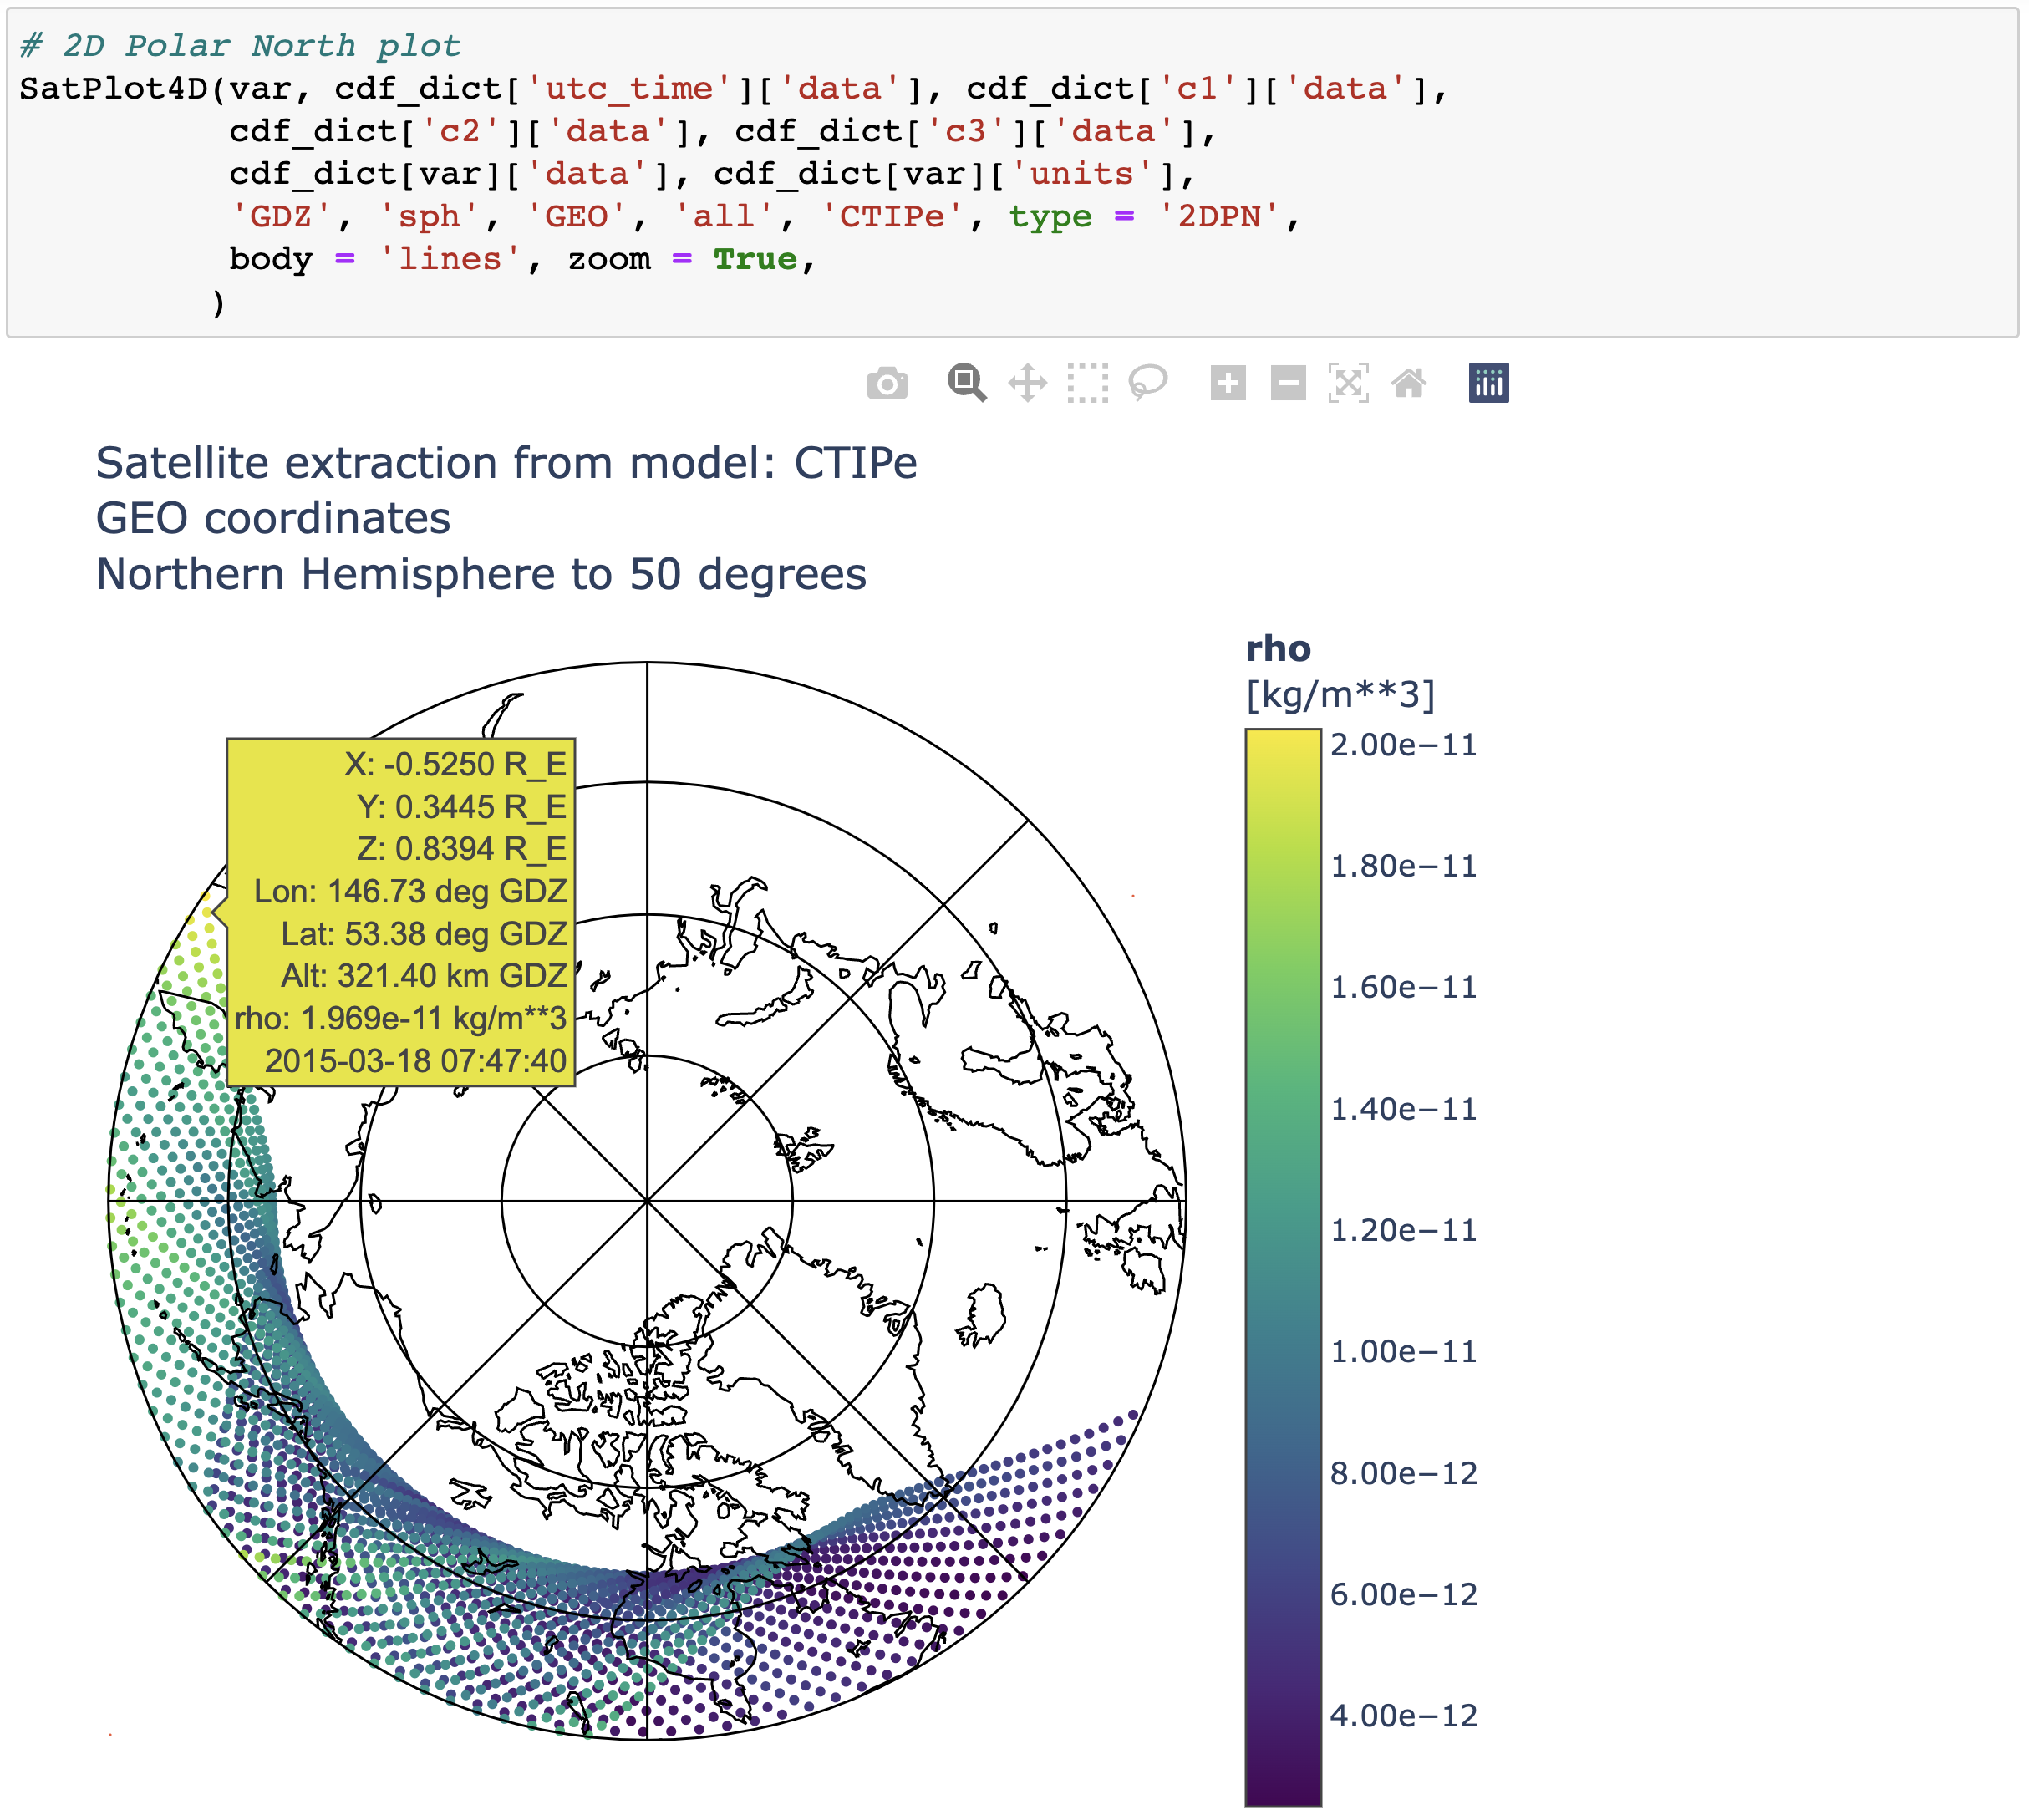
3D, 3Dv, 1D, 2D, 2DLT, 2DPN, 2DPS
body: string choice of 3D inner body, values: black, earth (GEO), none
zoom: logical to show zoomed in view for polar plots
divfile: string with filename to save a html div file of the plot
htmlfile: string with filename to save a full html file of the plot
plotCoordType1D: displayed coordinate type for 1D plots. car, sph
vUnit: units of quiver vector quantity, ie 'nT'
vxName: string name of X component of quiver vector, ie 'B_x'
vx: array of values of X component of quiver vector
vyName: string name of Y component of quiver vector, ie 'B_y'
vy: array of values of Y component of quiver vector
vzName: string name of Z component of quiver vector, ie 'B_z'
vz: array of values of Z component of quiver vector
vScale: length scale factor to quiver vectors
vSkip: skip this number of points between displaying quiver vector
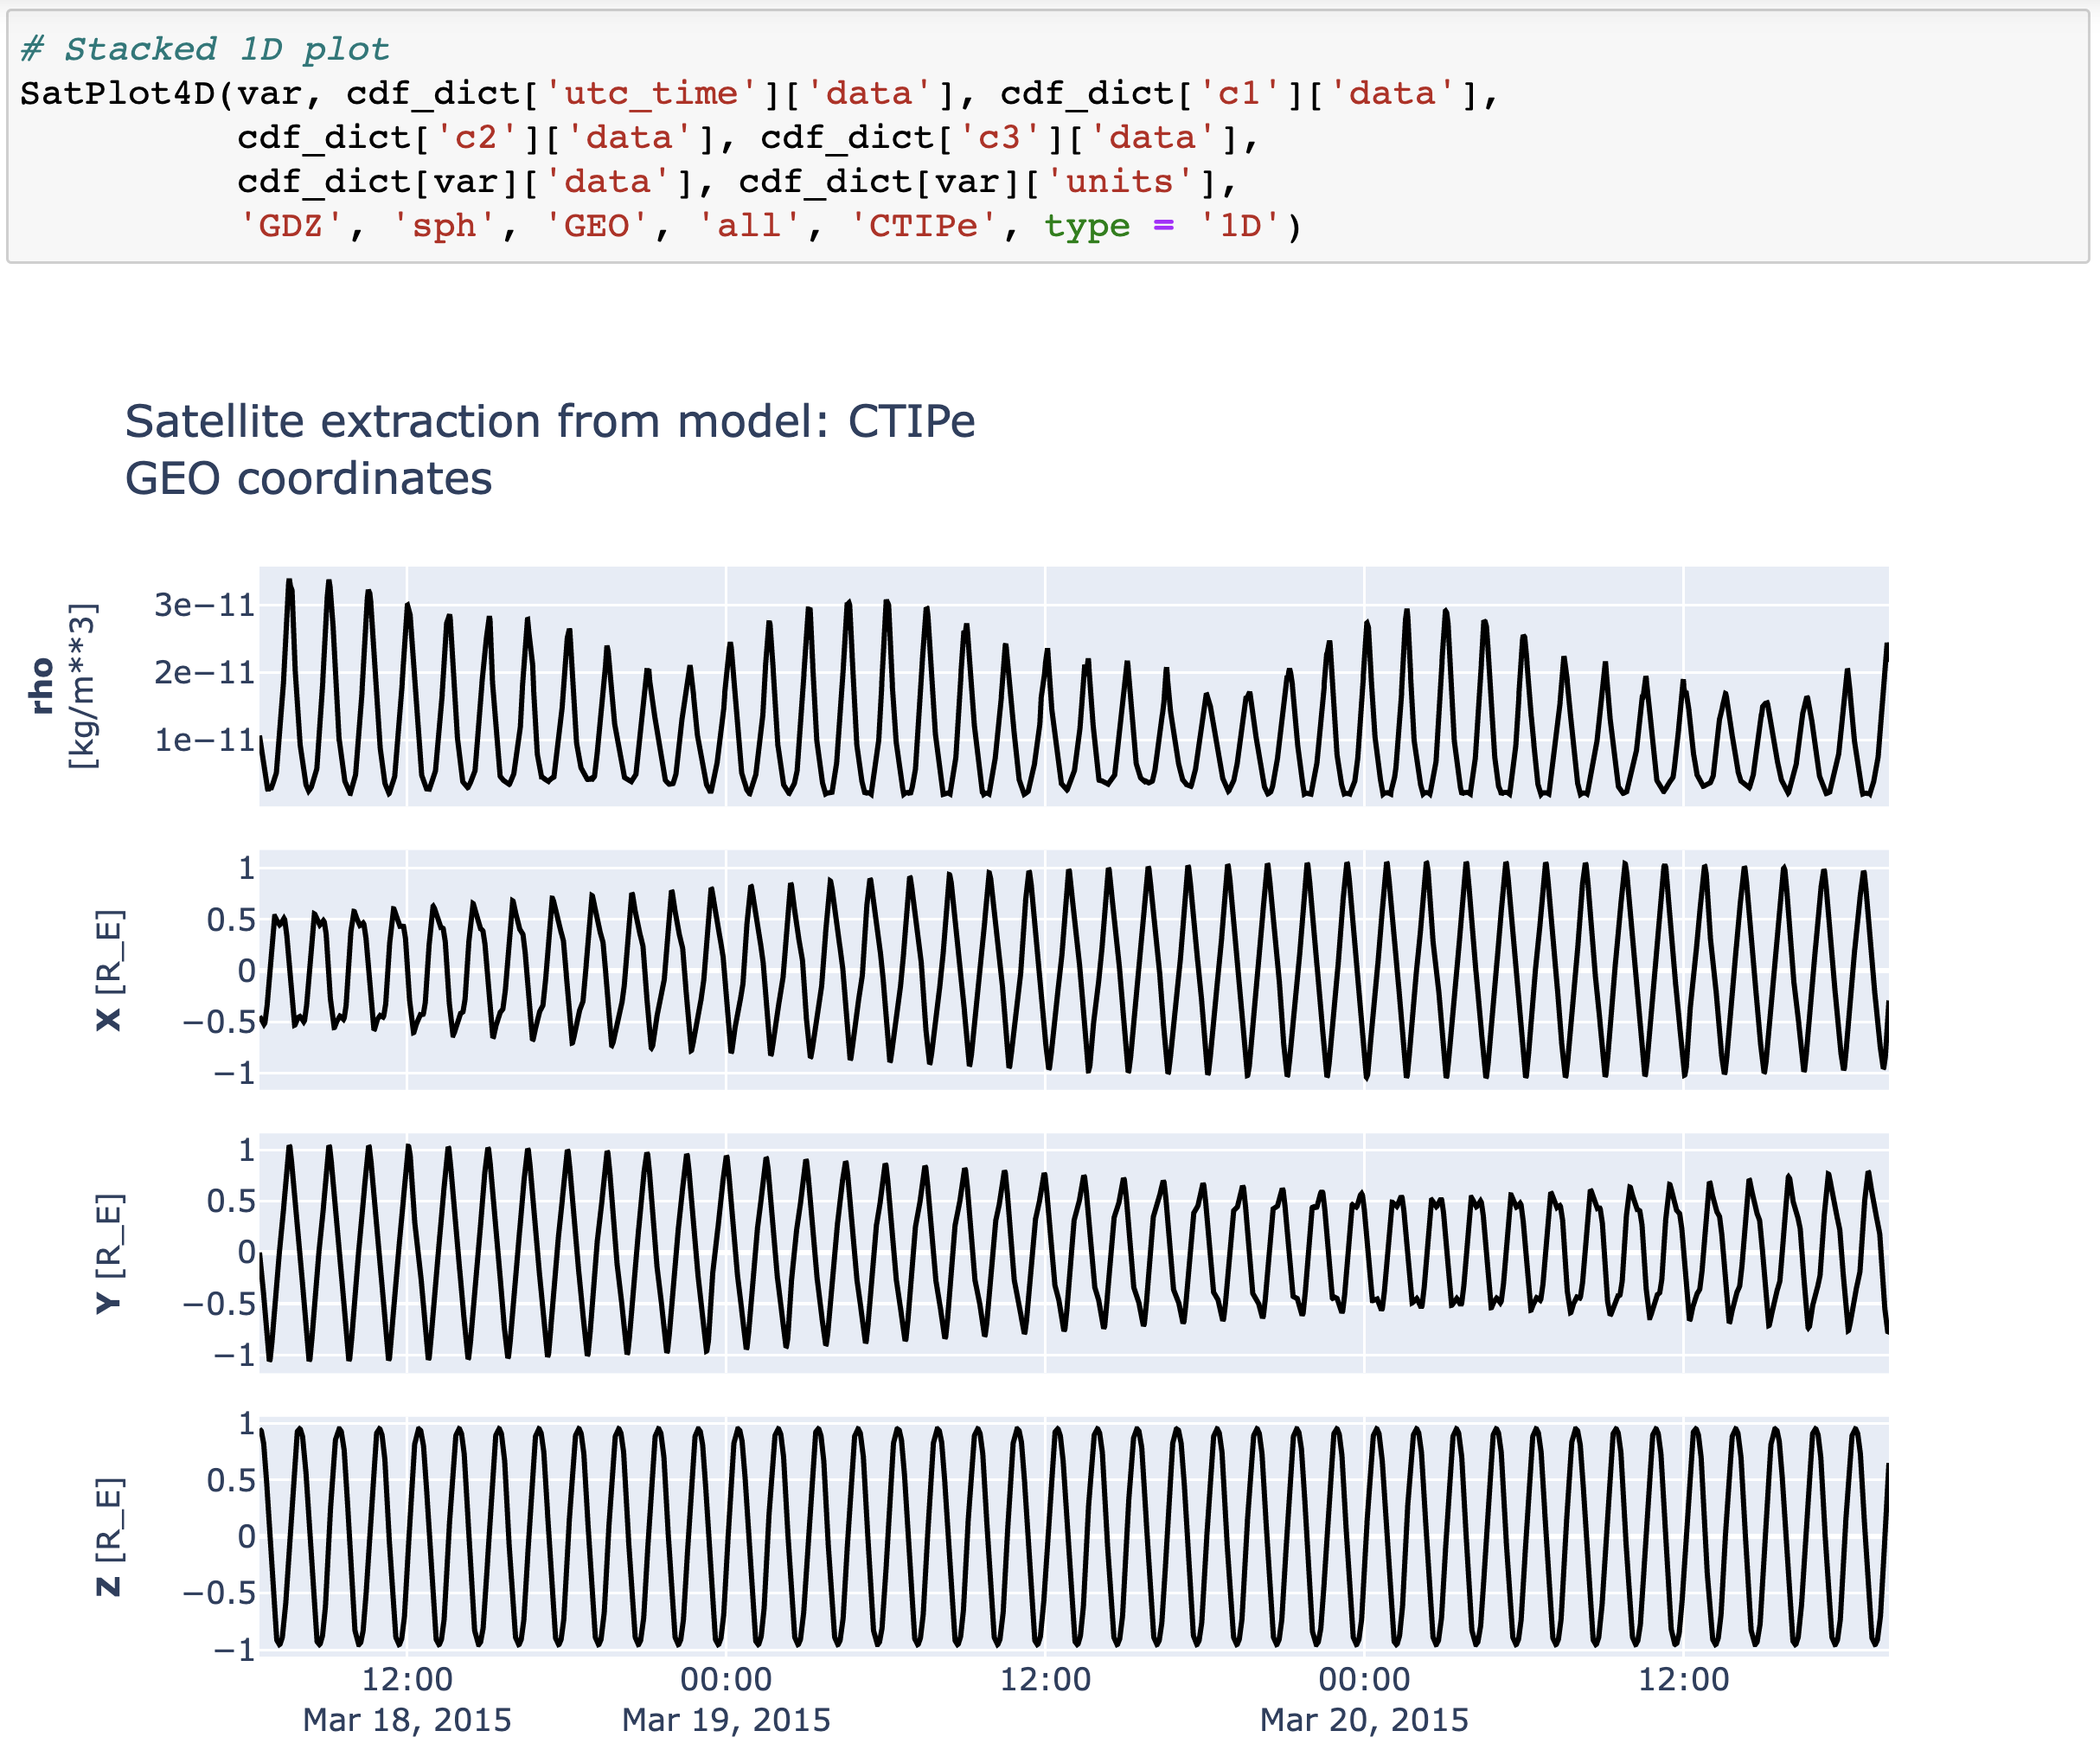
Load data and make several different plots
# Load a saved satellite flythrough file (or use data in memory)
from kamodo_ccmc.flythrough.SF_output import SFcsv_reader
cdf_dict = SFcsv_reader('Files/FakeFlightExample_CTIPe20s.csv')

var = 'rho' # variable to plot
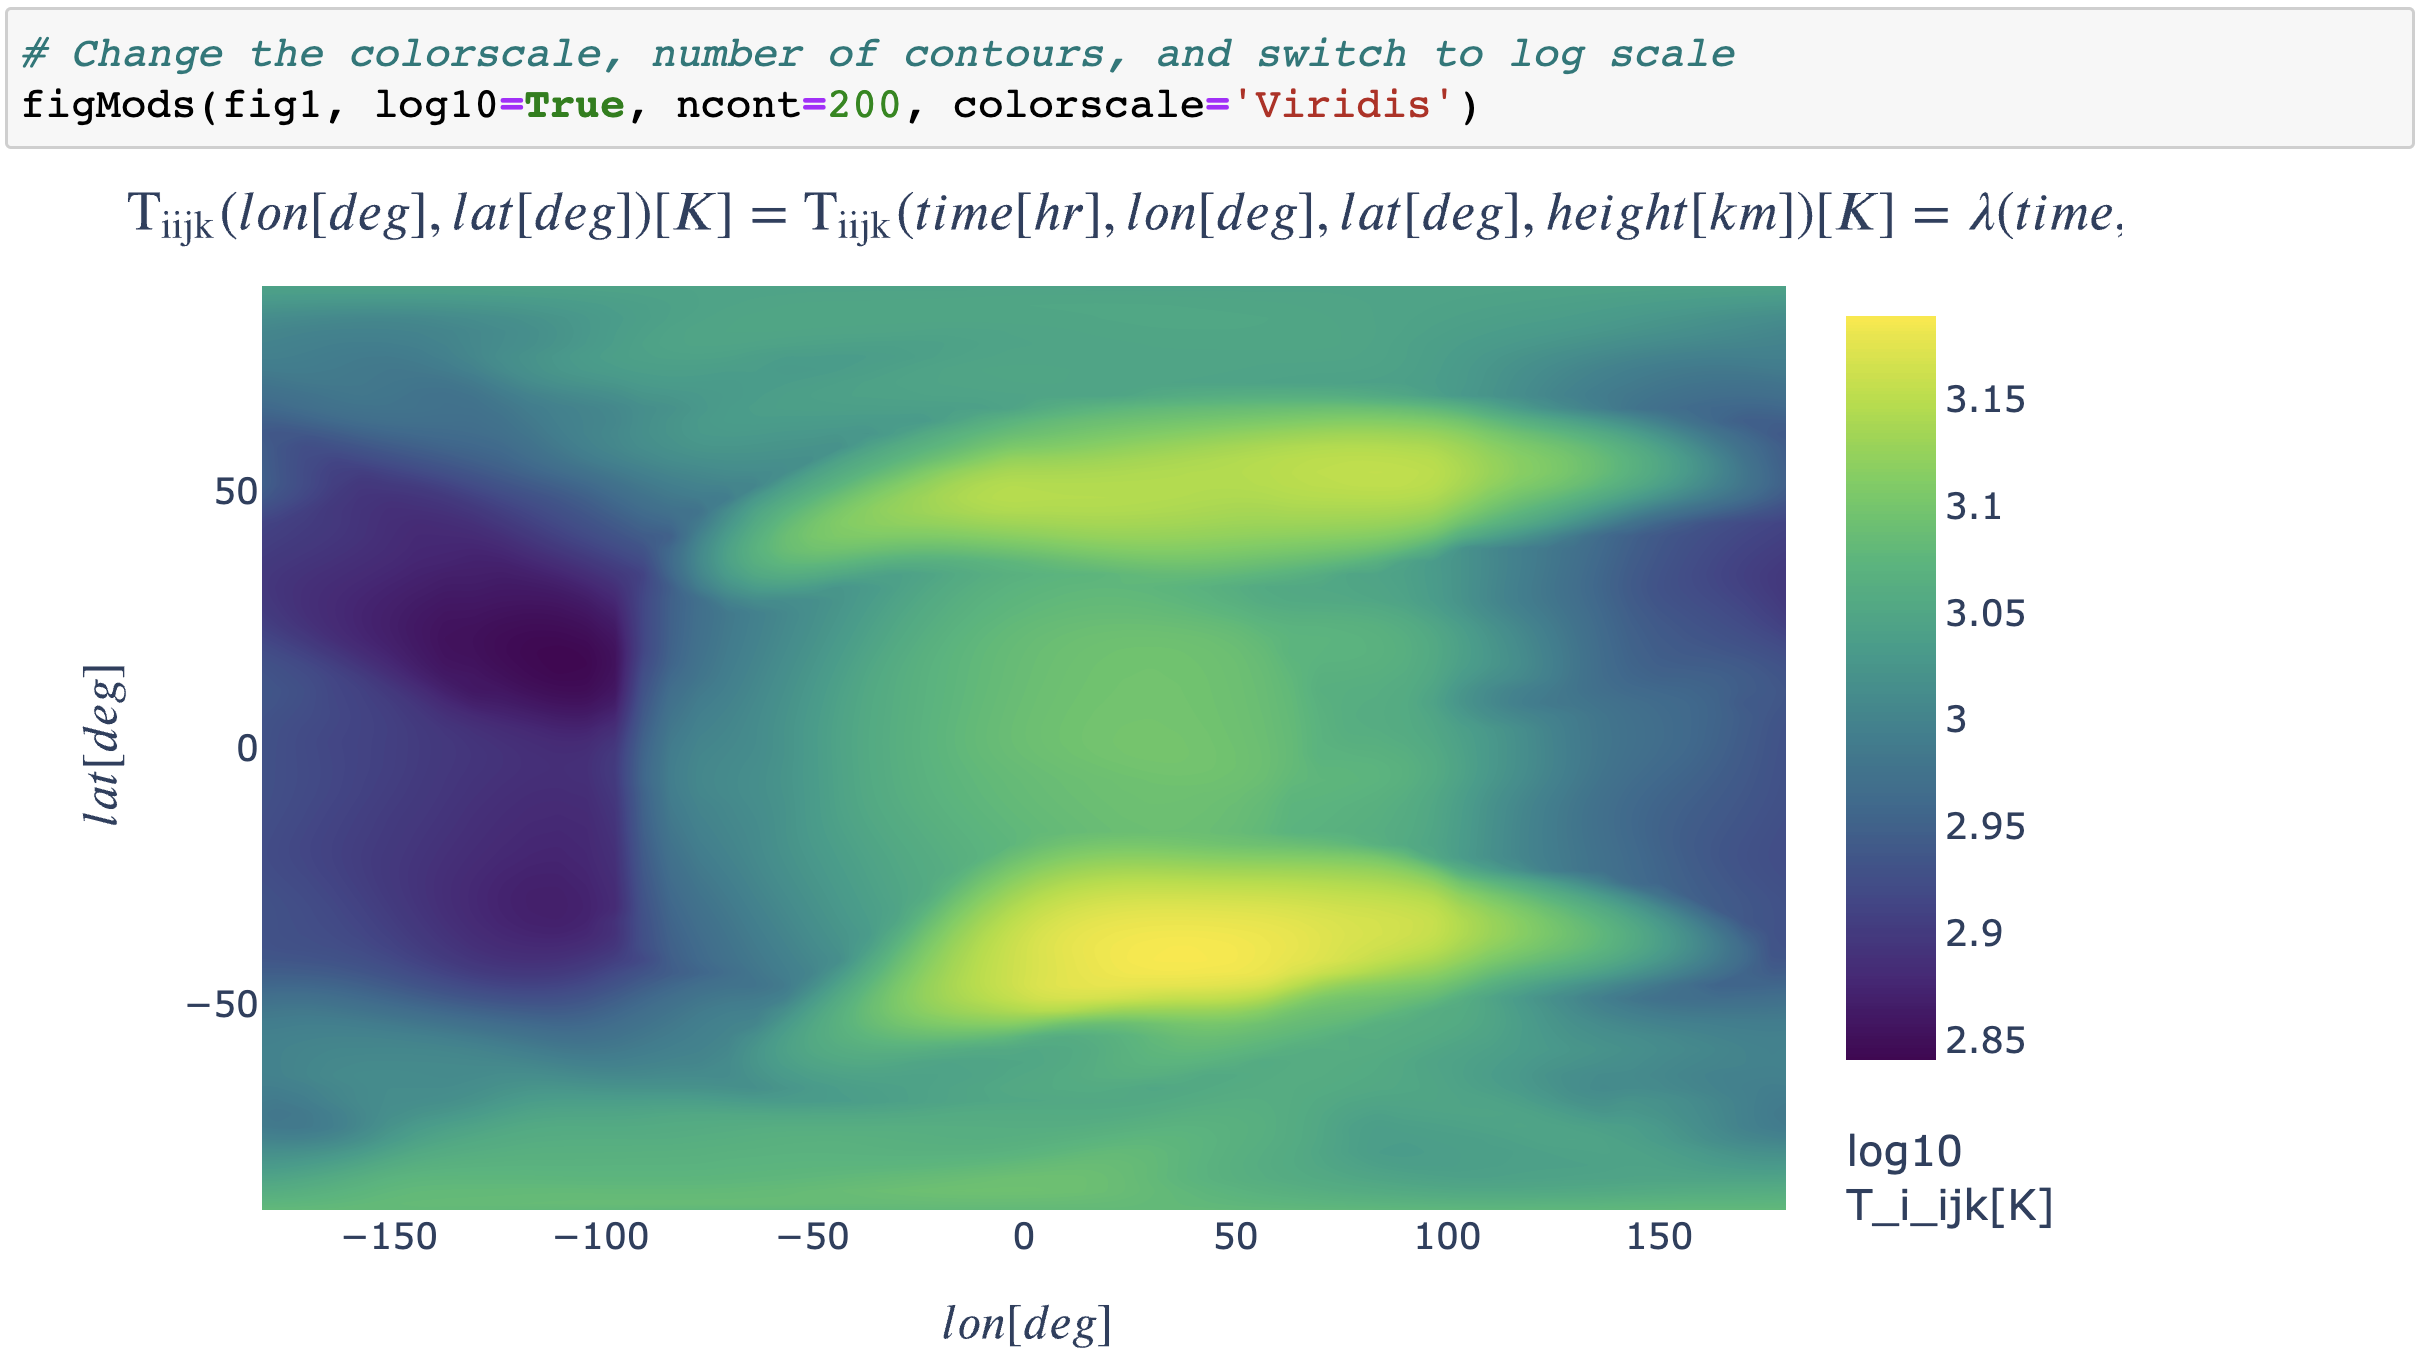
Other ways to modify figures
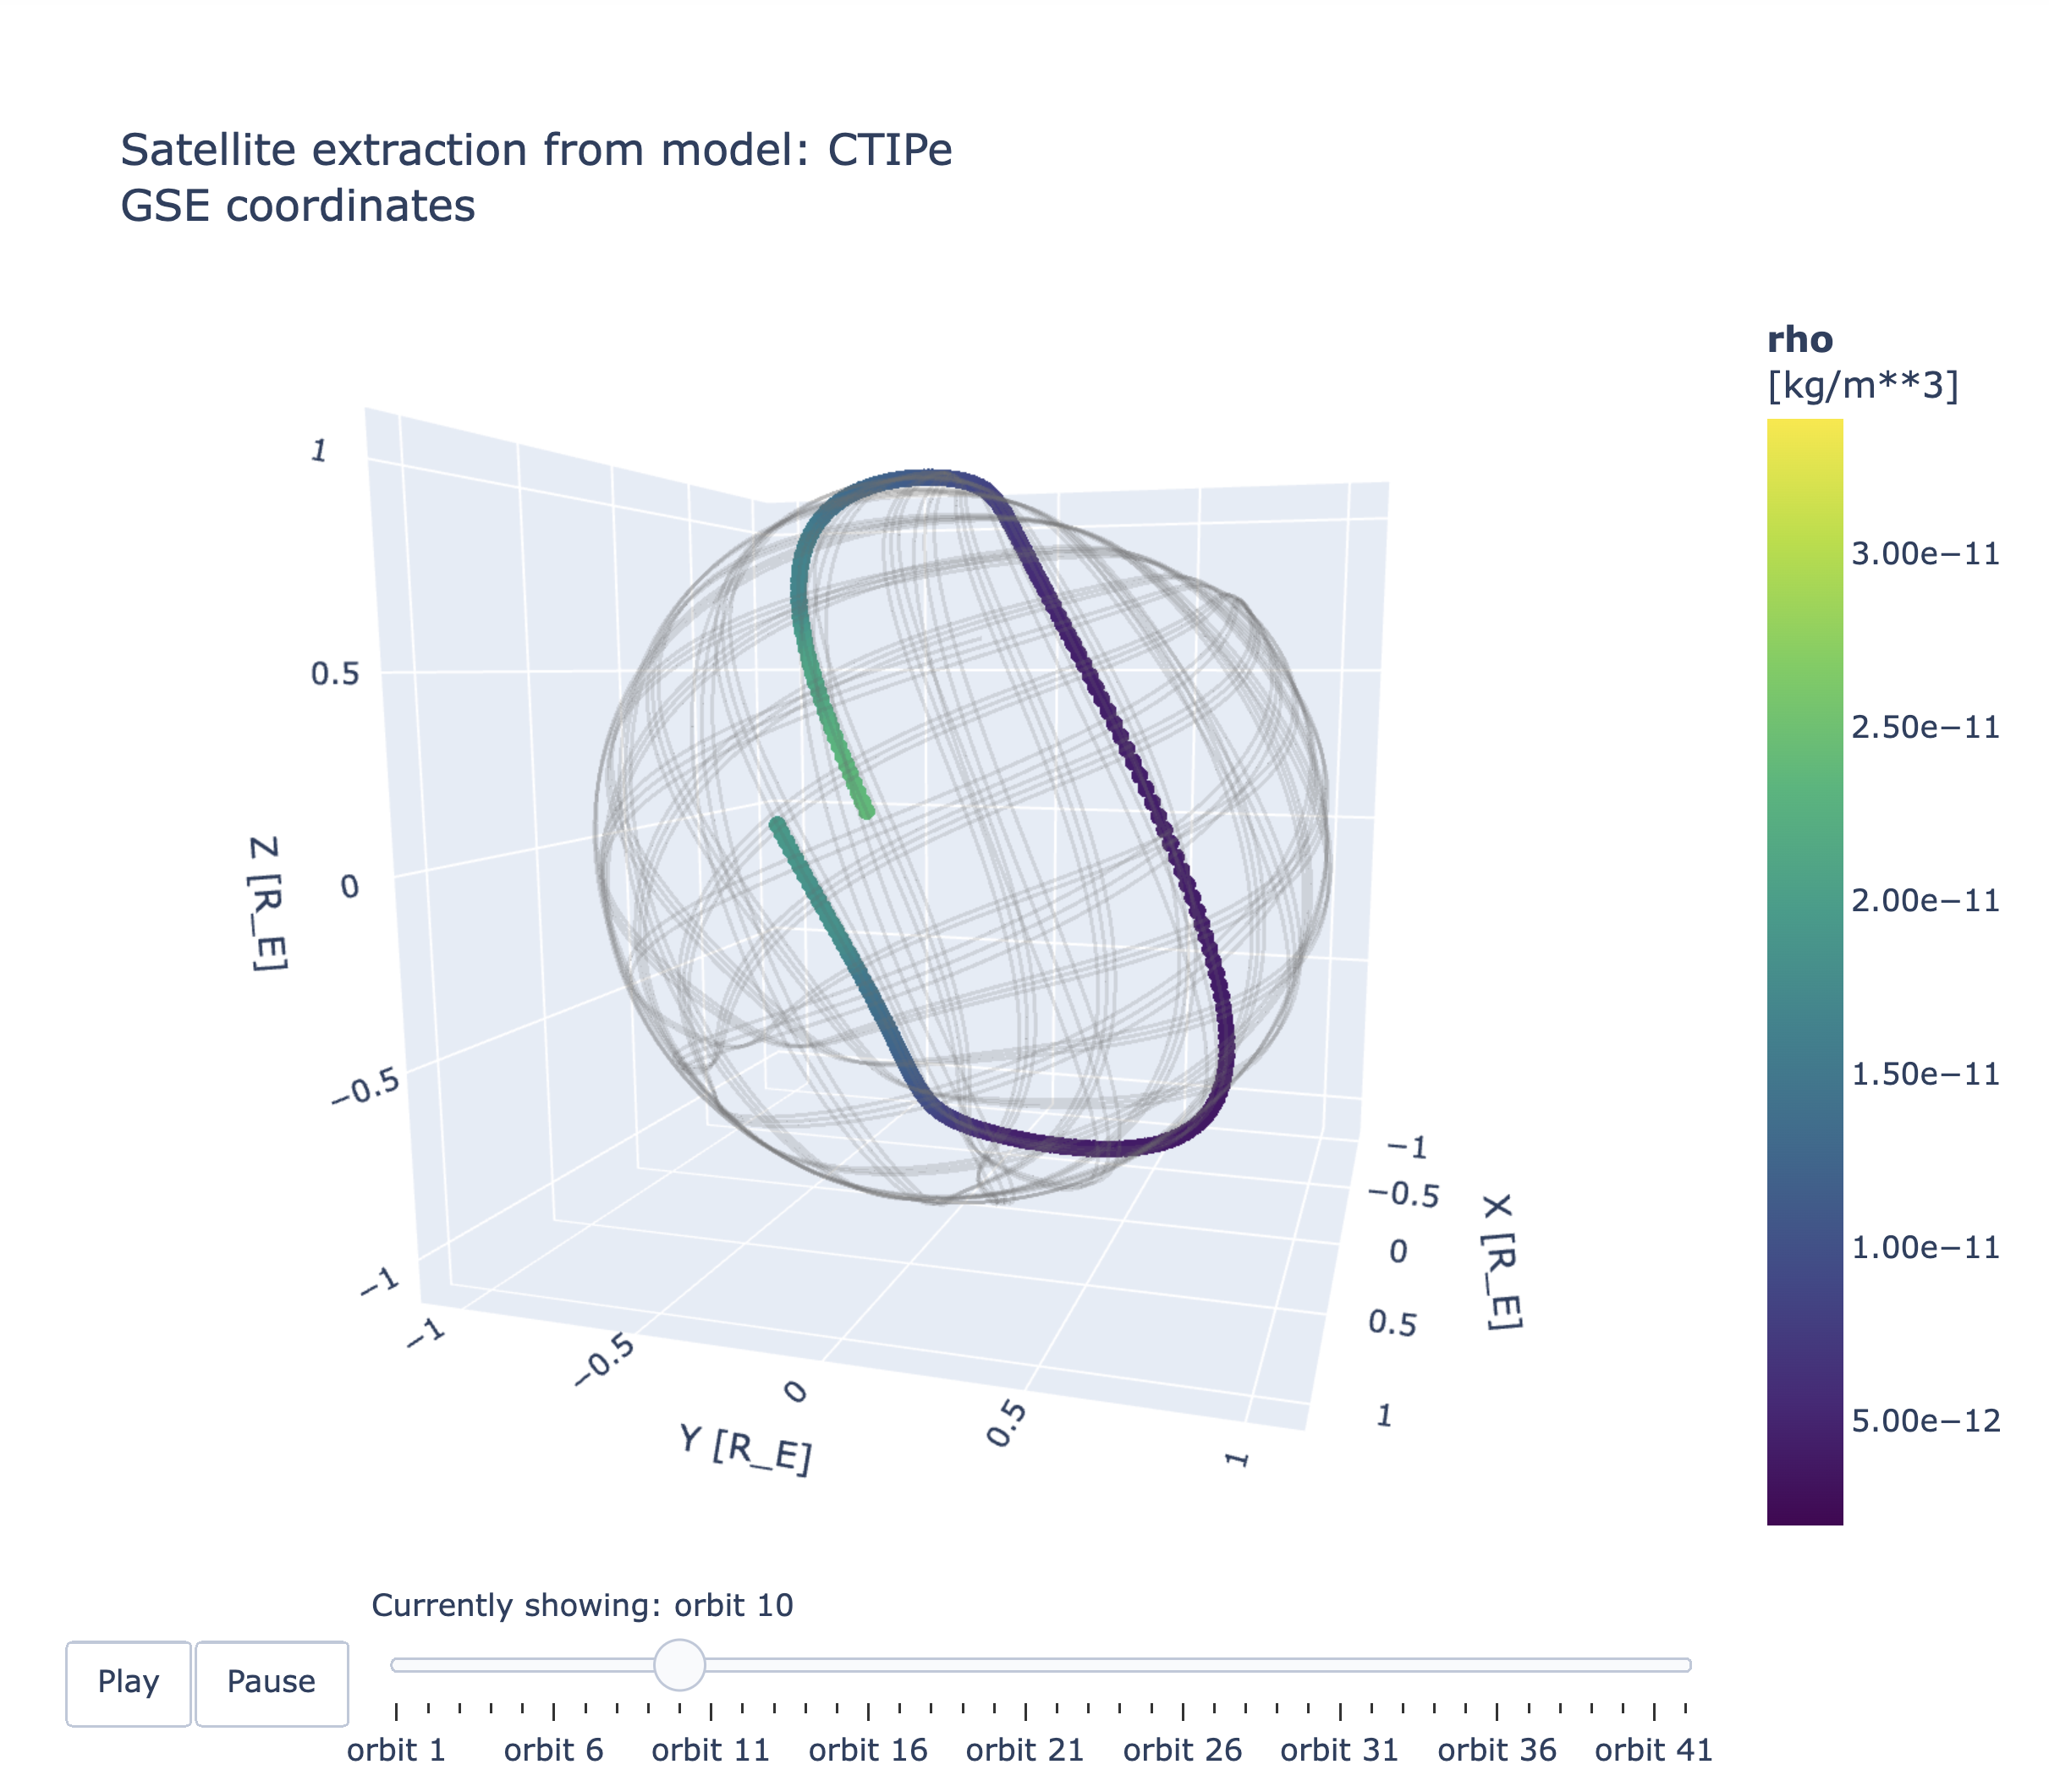
We have already loaded a kamodo_object with a couple of days of model output (not shown). With time and altitude fixed, the plot will show the ion Temperature for all latitude and longitude values.
Now we compare the default plot for a slice through the model at noon and 500km altitude with one where several plot parameters are modified, for a subjectively more appealing figure.
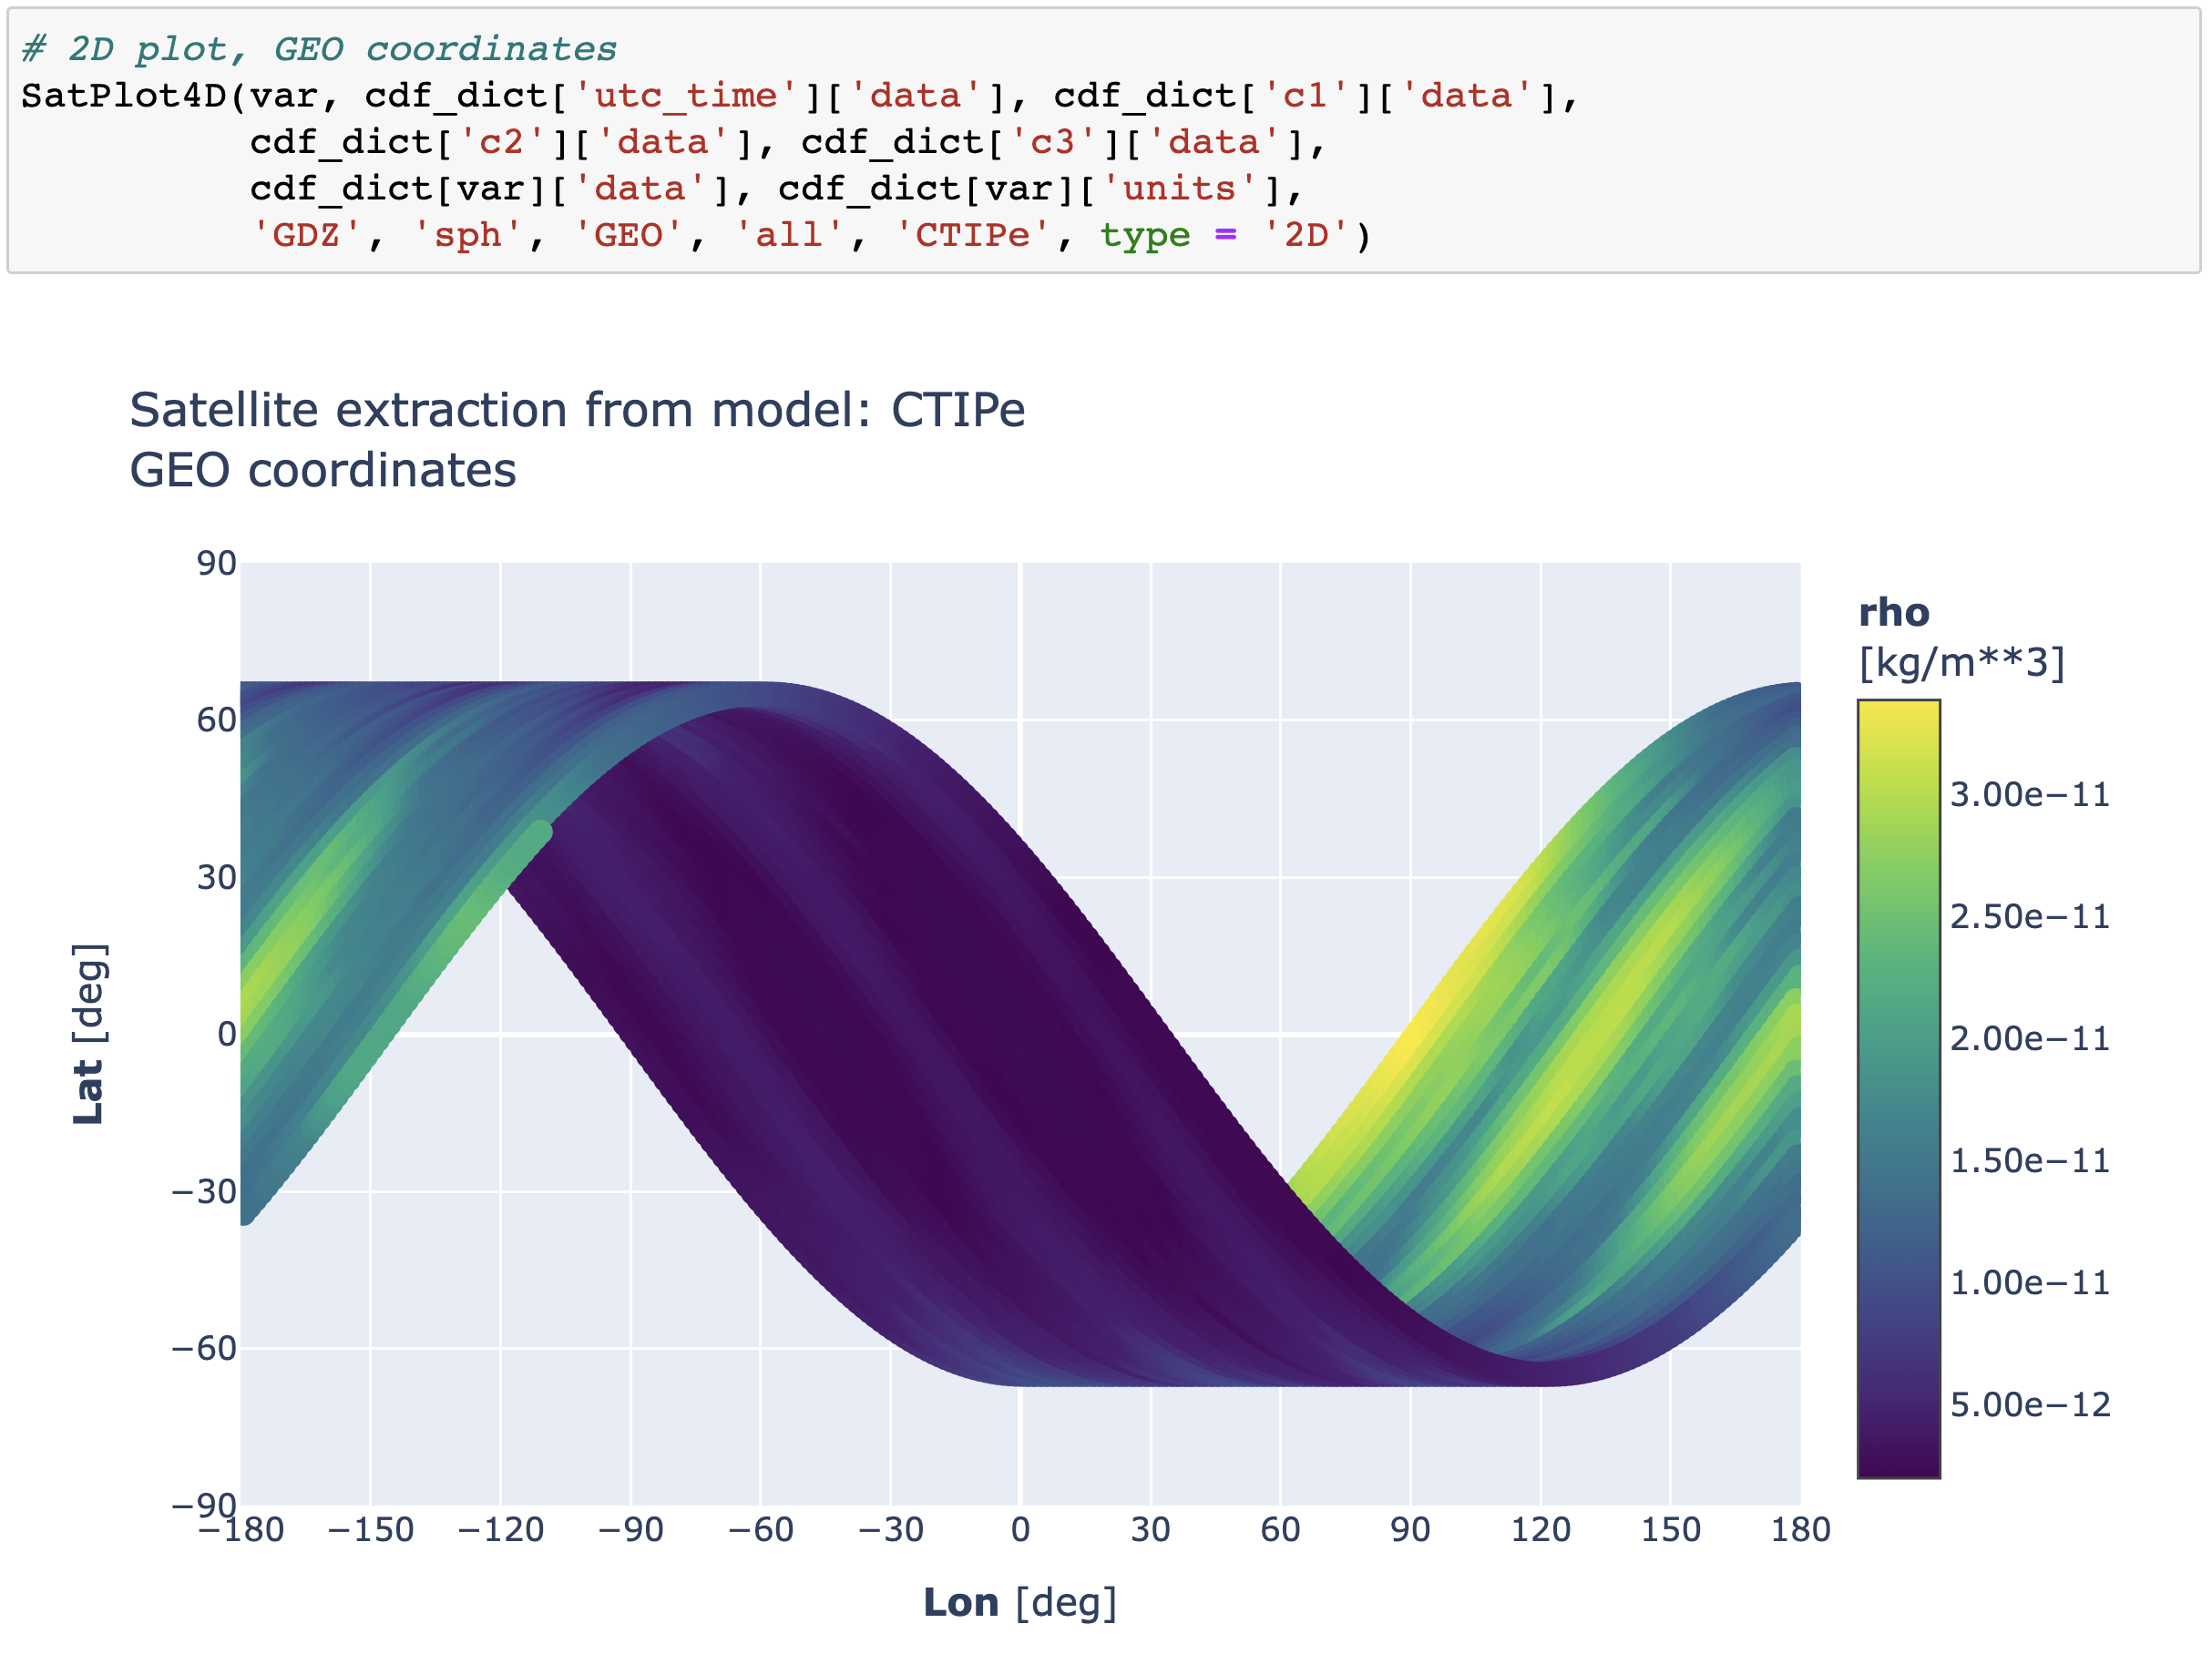
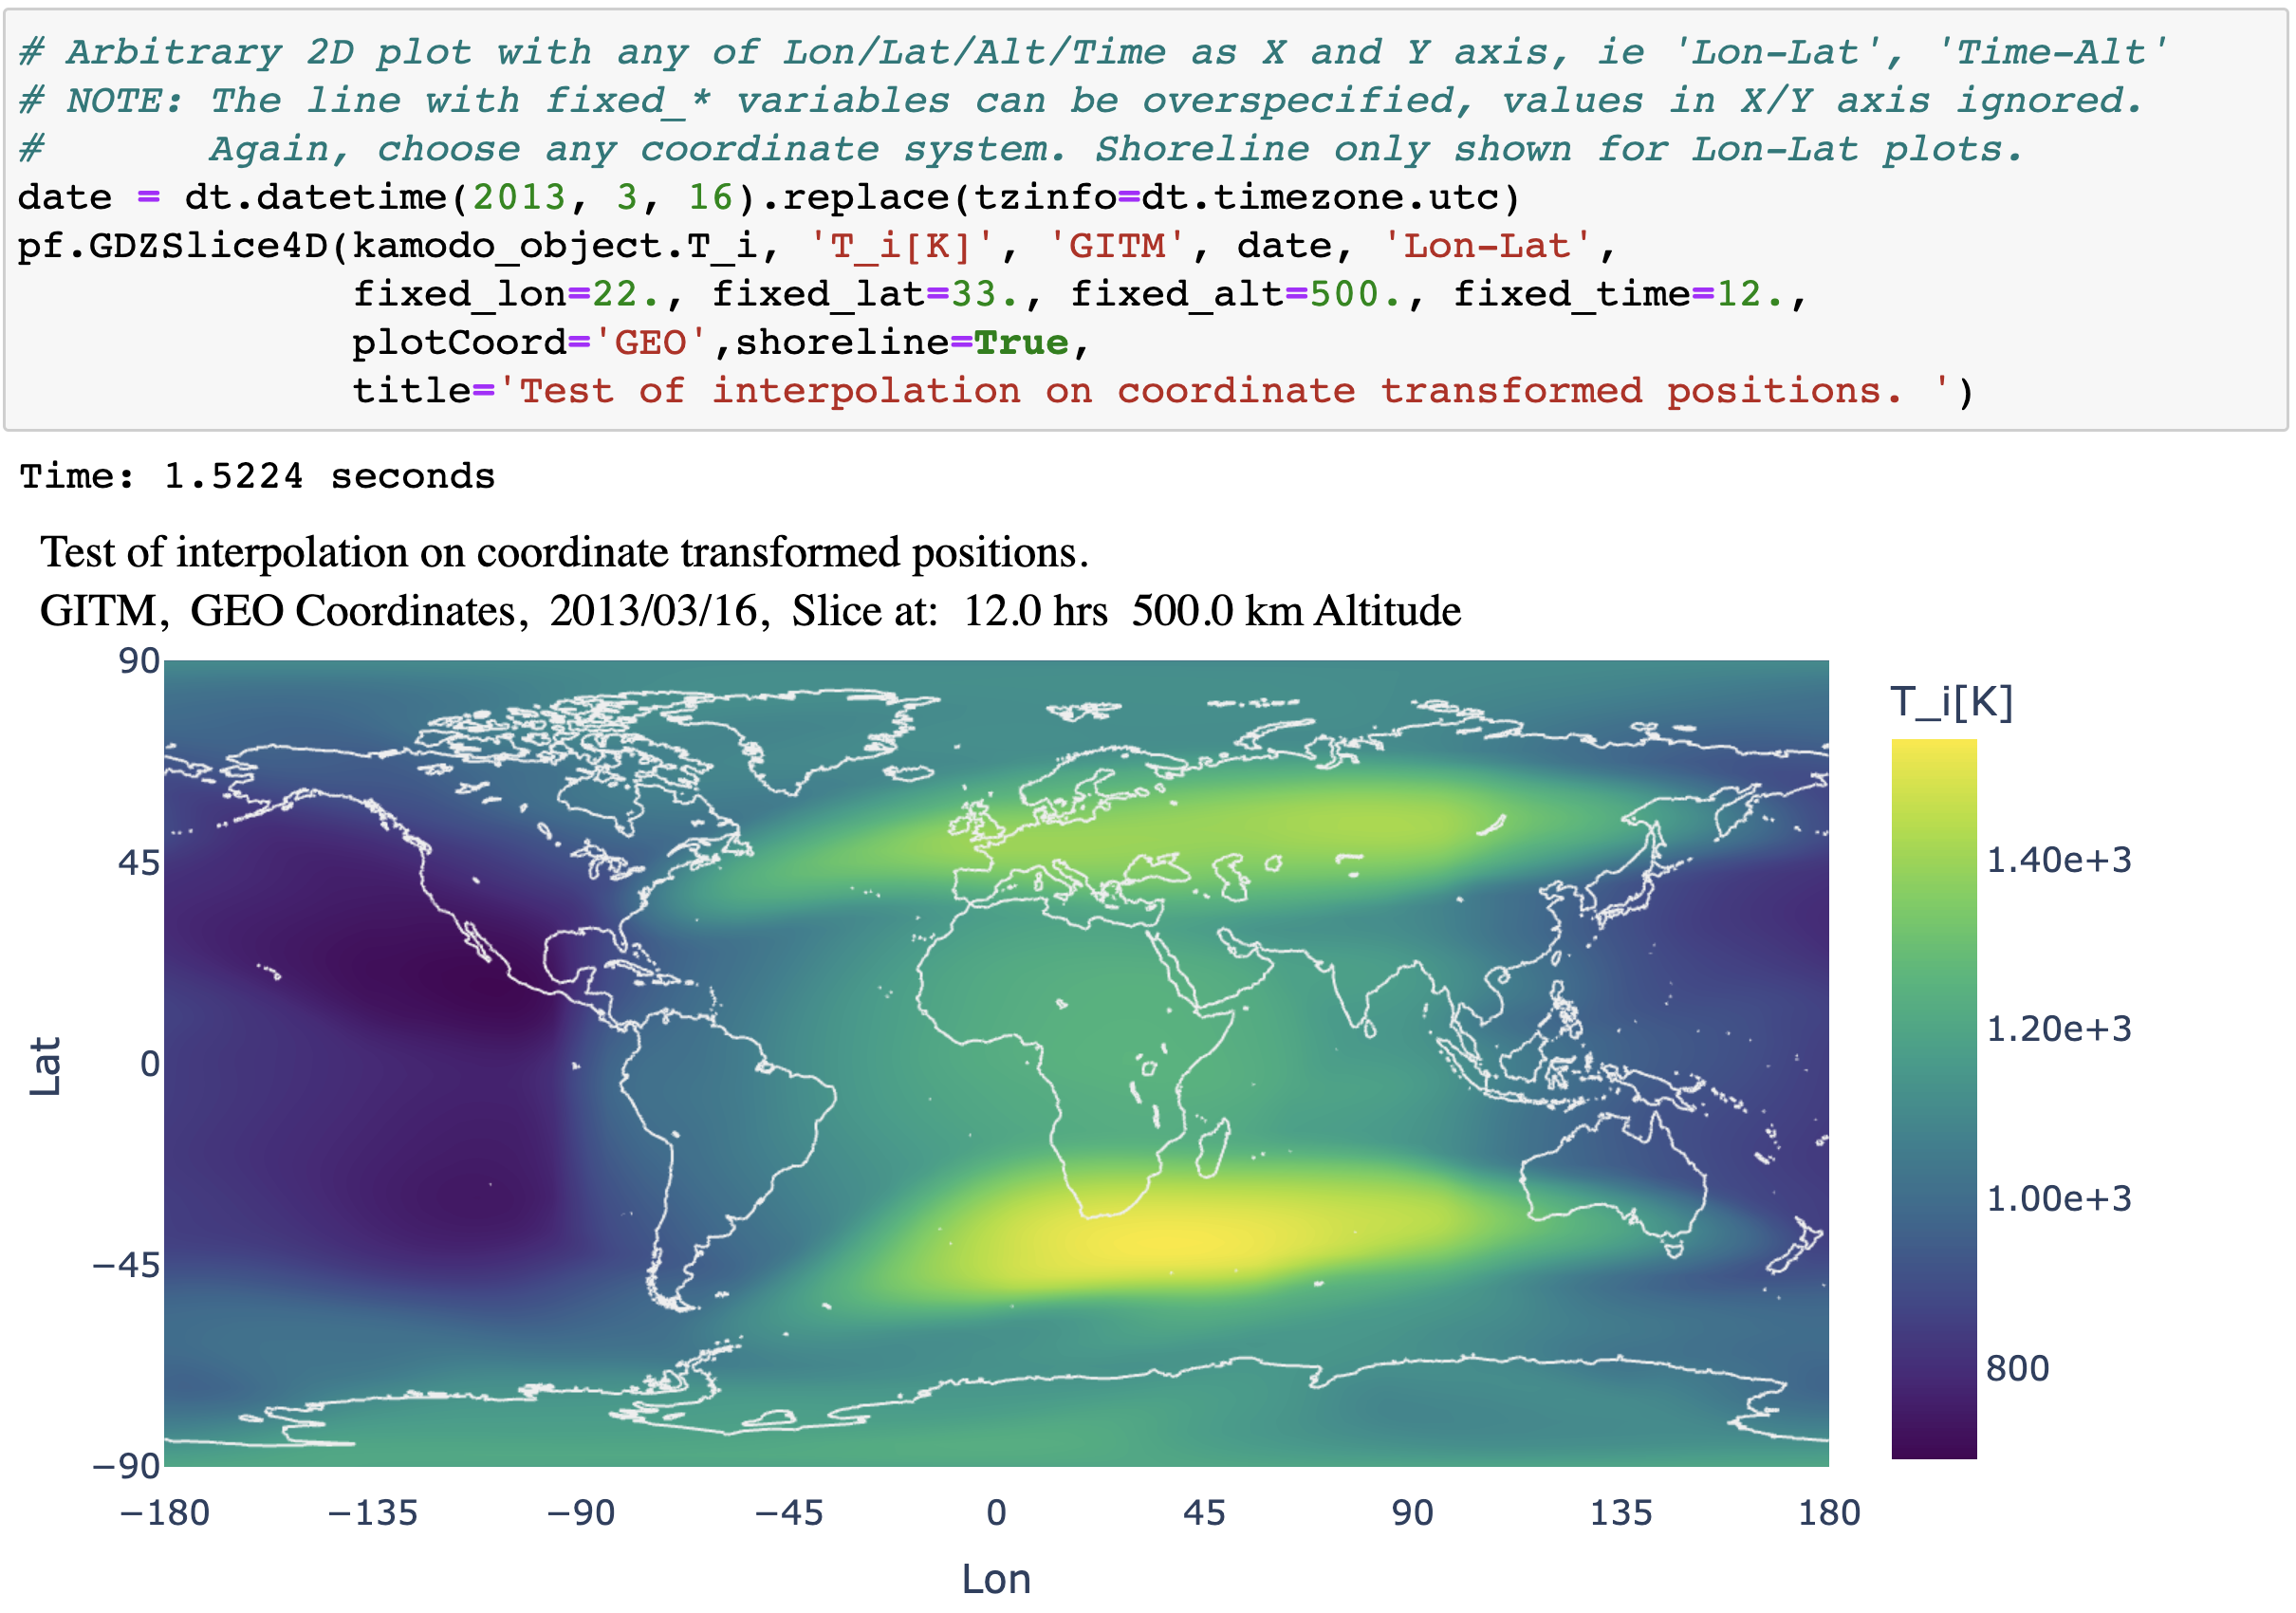
While these are improved plots, more can be done. Another plot modification function can pick any arbitrary two values from Lat, Lon, Alt, Time and plot in 2D. Any supported coordinate system is also available, and Earth shorlines can also be overlayed, as well as custom plot titles.
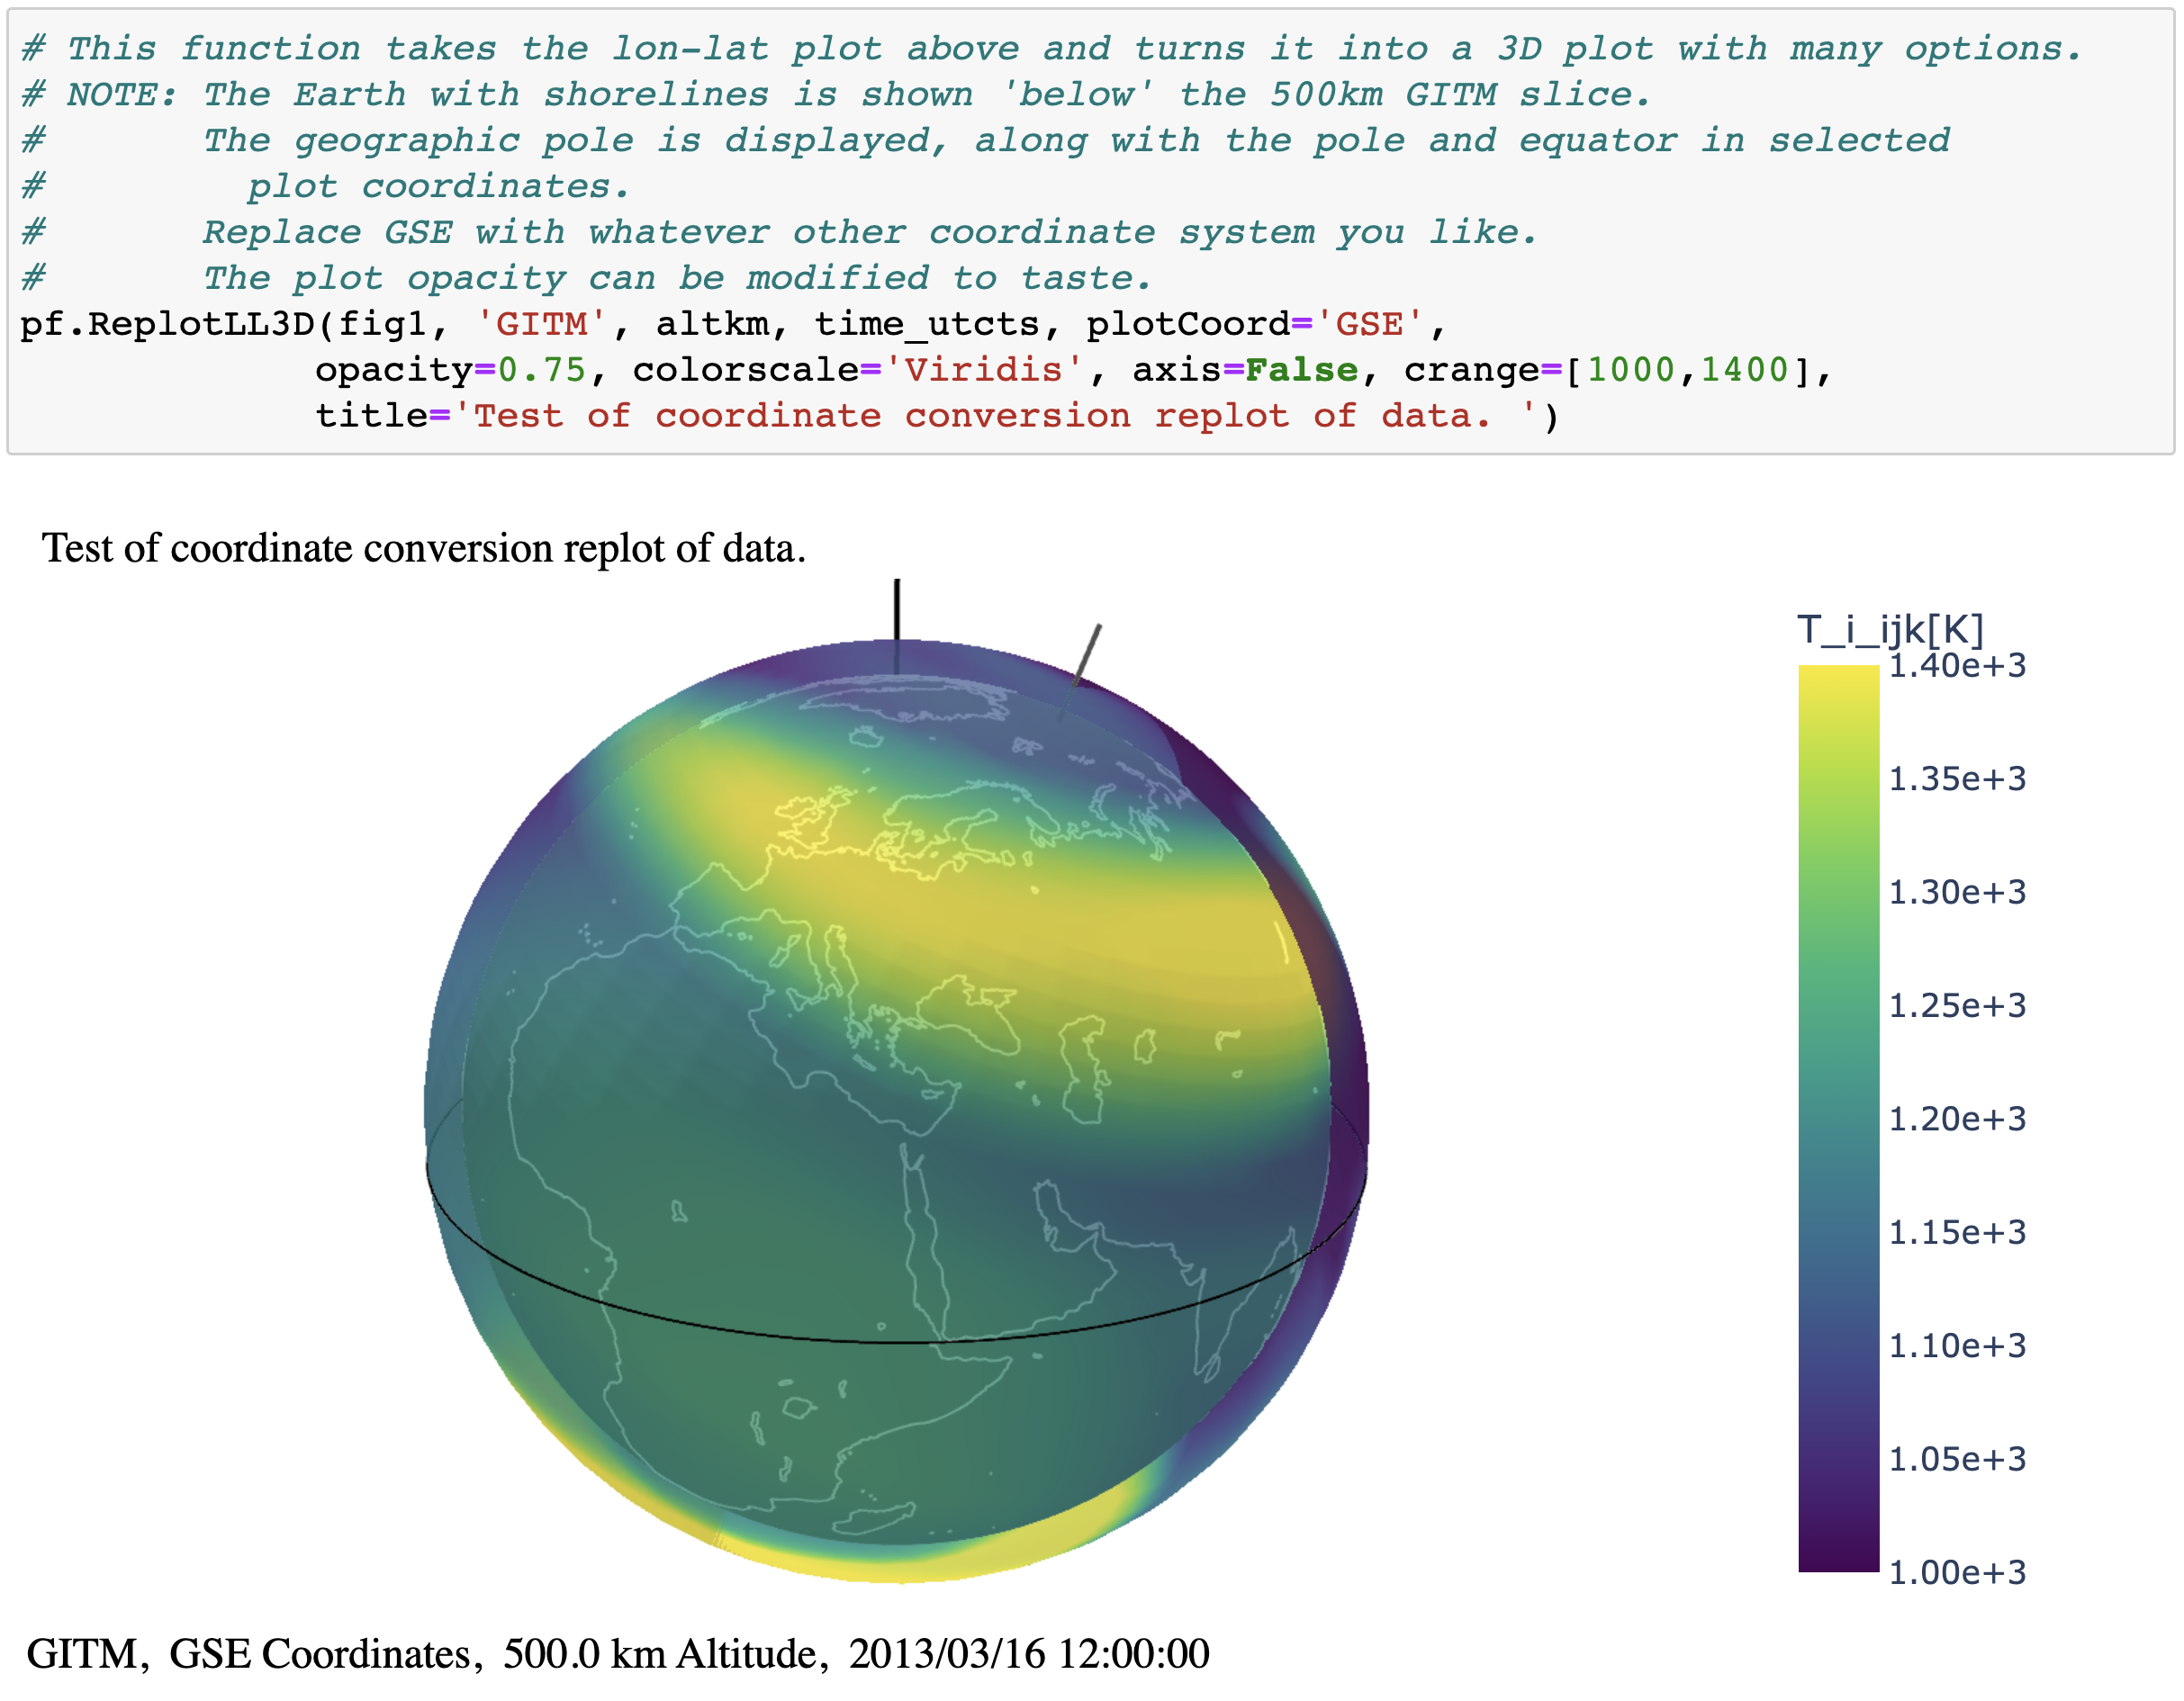
Alternatively, the original fig1 from above can be viewed in 3D, again with other customizations such as coordinate system, title, colorscale, and contour ranges.
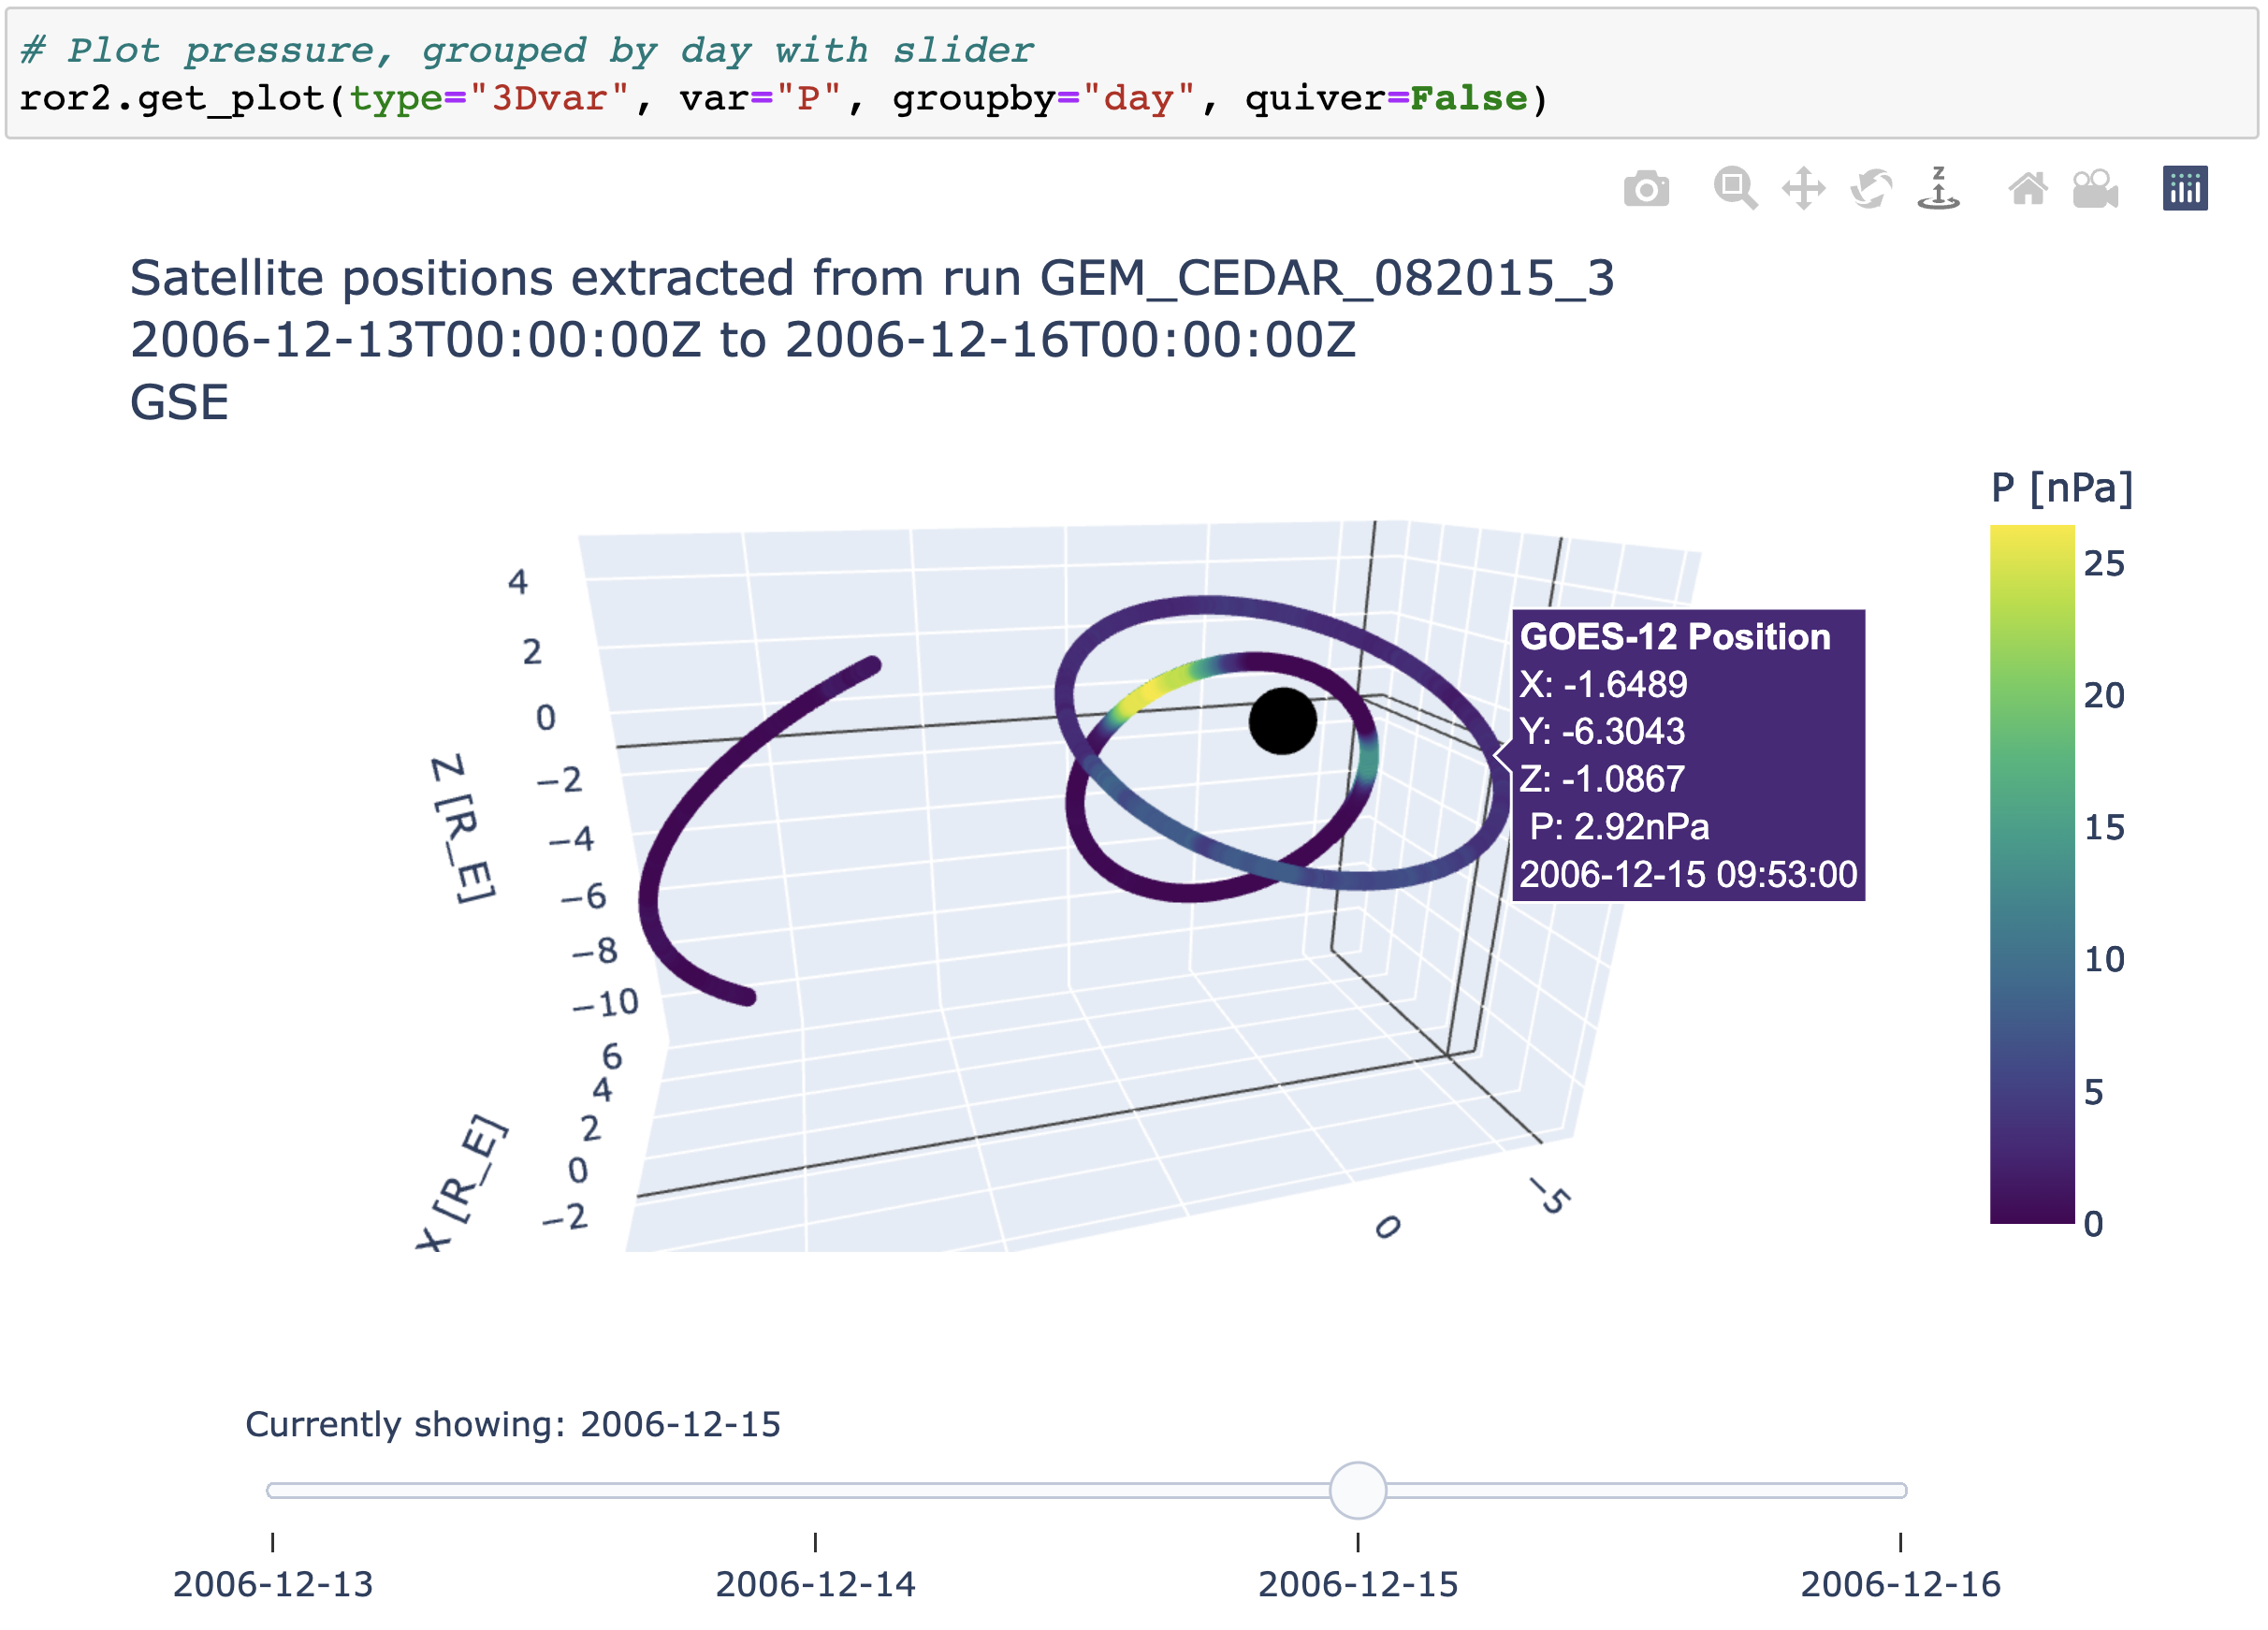
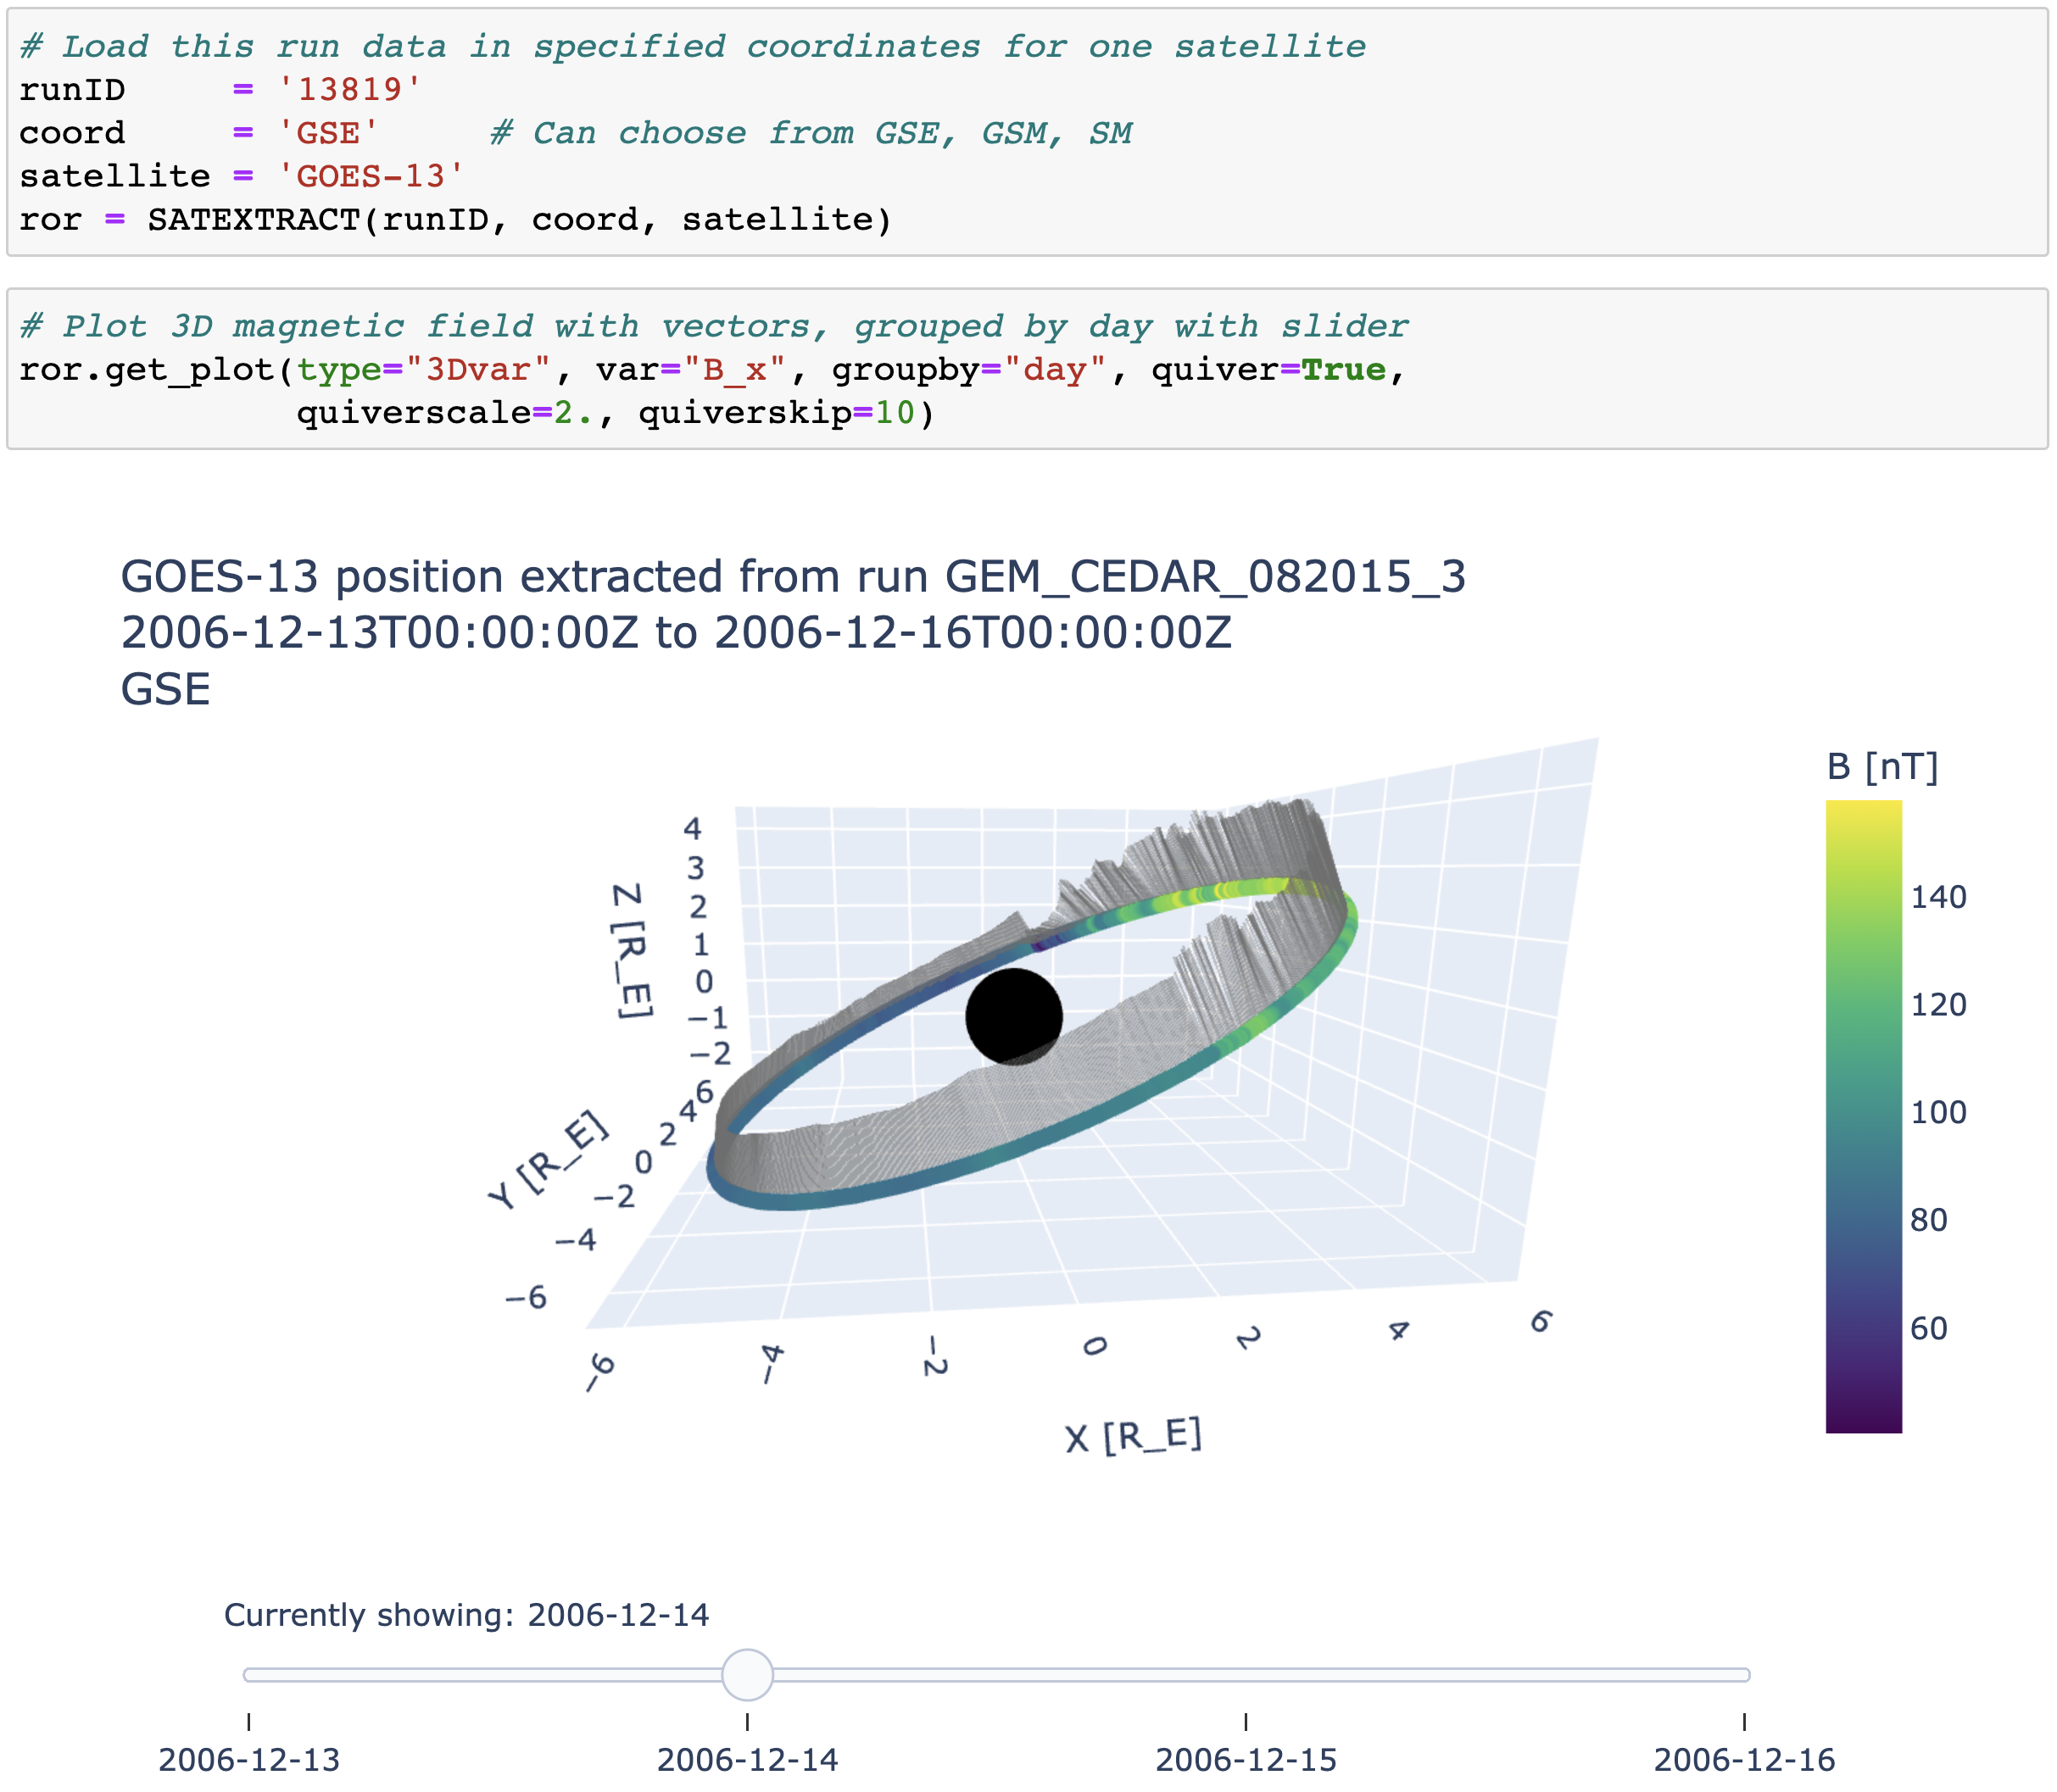
Custom plots for just one data source
Sometimes, custom plotting can't easily be generalized for all model readers yet. These custom options fit one model reader for now for specific types of plots. A custom model reader was written to read in satellite extractions from CCMC Run on Request magnetosphere runs. The custom plotting can show multiple satellite positions available for the duration of the run or it can pick one and show value and/or vector plots broken up into groupings by day or orbit.