
| Home → Tutorial Home → Plotting Recorded Data |
|---|
Viewing Recorded Data
To view recorded data, Trick provides an application called quick plot. NOTE: The GUI or plot graph figures may be shown differently on your machine due to the differences of the platforms and ongoing changes.
Using Trick Quick Plot
Begin by launching trick-dp (trick data products GUI).
% cd $HOME/trick_sims/SIM_cannon_analytic
% trick-dp &
Plotting Time -vs- Position
- Double click the pathname containing your sim directory (or single click the symbol next to the name)
- Double click the
SIM_cannon_analyticname in the Sims/Runs pane. This will reveal theRUN_testdirectory. - Double click the
RUN_testname. This will bringRUN_testinto the RUN Selections pane below. - Click the blue lightning button in the tool bar to launch quick plot (qp). The qp GUI will pop up.
- In qp, right click the
dyn.cannon.pos[0-1](m)variable in the left pane and choose Expand var. Next double clickdyn.cannon.pos[0](m). This sets up qp to create one page with one plot (time -vs- pos[0]). - Now click the
dyn.cannon.pos[1]variable and drag it to the pane on the right. Drop it on the line with "Page" (see the white-n-black window looking icon). This will result in one page containing two plots. - In qp, click the plain white sheet icon located on the toolbar. A single window with two plots should pop up. (See Figure 4)
- When you are done with the plots you created, close the Trick Plot window which will also close the window with your plot(s).
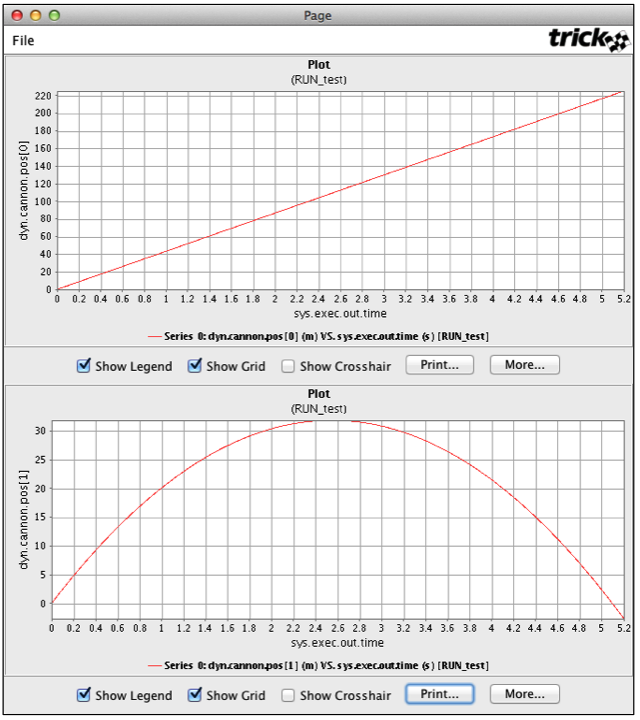
Figure 4 - Quick Plot Time -vs- Position
Plotting XPosition -vs- YPosition
- Right click "Plots" in the "DP Content" pane and choose "Remove All Pages".
- Double click dyn.cannon.pos[1].
- Drag-n-drop the dyn.cannon.pos[0] variable over the sys.exec.out.time variable in the Plot located in the "DP Content" pane. You will be asked to confirm the replacement. Click "Ok".
- To see the plot, click the white sheet icon on the toolbar. Voila! There is the trajectory! :-) Note that the cannonball goes underground. This will be fixed later.
- When you are done, close the Trick Plot window.
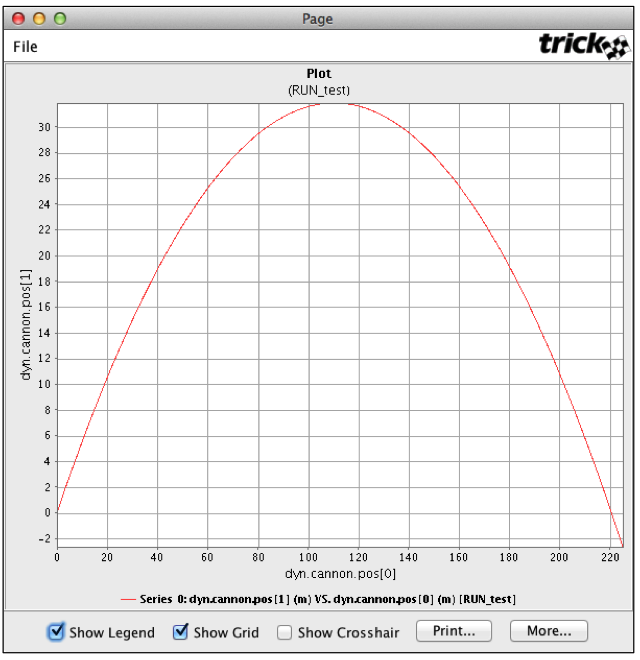
Figure 5 - Quick Plot X -vs- Y Position
Creating a DP Specification File
Repeatedly clicking variables in Trick QP gets old, fast. To get around this,
the information needed for this plot will be saved to a file named
DP_cannon_xy, and then reused by trick-dp. This is an important step,
because extensive use will be made of the DP_cannon_xy file.
-
With the Trick QP GUI still up and the x -vs- y position still chosen, click the
dyn.cannon.pos[1]variable located in the pane on the right (in the DP Content pane). The variable should be highlighted. The Y Var notebook page should be visible in the lower right pane. -
In the Y Var notebook page, select Symbol Style->Square from the drop-down menu.
-
In the Y Var notebook page, select Symbol Size->Tiny from the drop-down menu.
-
Click the Apply Change button (you may have to scroll up to see the button).
-
Save this information by clicking the menu option File->Save As. Click New Folder button to create the
DP_Productfolder. Choose the directory buttonSIM_cannon_analytic/DP_Product. Enter file name asDP_cannon_xy. -
Close the Trick QP GUI, but keep Trick DP up and running.
Using trick-dp To View Data
Now that DP_cannon_xy has been saved, the data can be viewed with trick-dp.
-
Assuming the Trick DP is still up and running from the previous steps, click Session->Refresh… to reveal
DP_cannon_xy.xmlin the top right pane, DP Tree. -
Make sure that
Sims/Runs->SIM_cannon_analytic/RUN_testshows up in the Run Selections pane. If not, then double click it to add it. -
Choose the
DP_cannon_xy.xmlin the top right pane by double clicking it. This will bring theDP_cannon_xy.xmlinto the DP Selections pane. -
To see the trajectory again, click the plain white single sheet button on the toolbar. Zoom in by holding the middle mouse button and drag across a section of the plot. Then release the mouse button. Notice that there is a tiny square on each x-y point recorded.
-
Once you are finished with the plot, close the Trick Plot window and Trick DP.
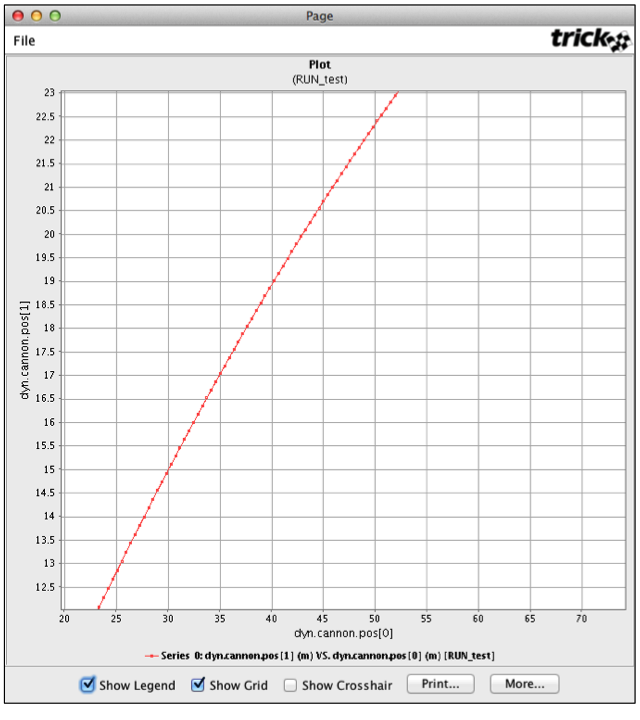
Figure 6 Zoomed X -vs- Y Position - DP_cannon_xy