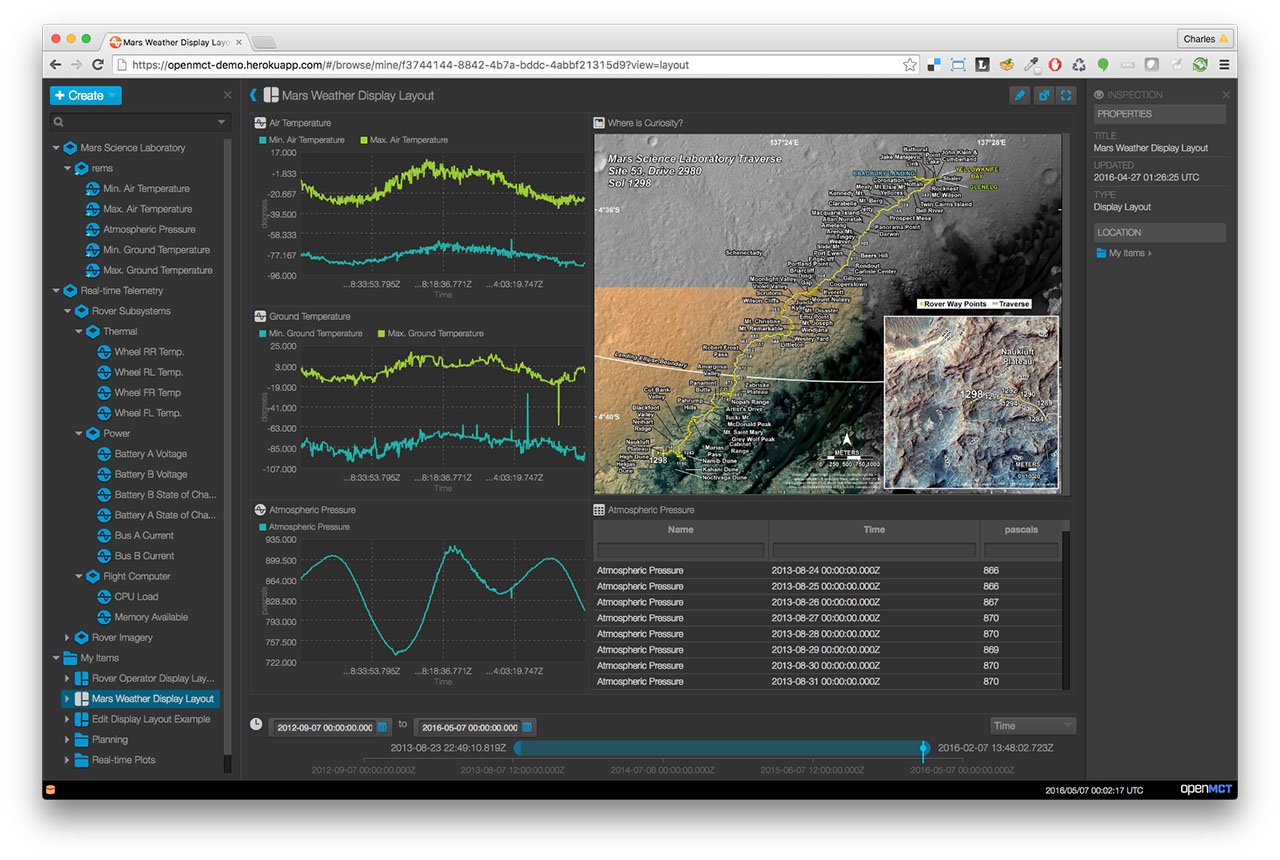
Open MCT is a next-generation mission operations data visualization framework. Web-based, for desktop and mobile.
How is NASA using Open MCT?
Software based on Open MCT is in use as a data visualization tool in support of multiple missions at the Jet Propulsion Laboratory, and at NASA's Ames Research Center to support the development of lunar rover mission concepts.

How Can You Use Open MCT?
Open MCT can be adapted for planning and operations of any system that produces telemetry. While Open MCT is developed to support space missions, its core concepts are not unique to that domain. It can display streaming and historical data, imagery, timelines, procedures, and other data visualizations, all in one place.

How to Contribute
We are looking for enthusiastic people who want to help contribute to NASA’s exploration of the solar system. Are you a student, professional software developer, or just a space enthusiast? We’d love to hear your ideas for new features or ways of visualizing data. If you’re a coder you can help us develop new features or capabilities, and fix bugs.

Developers: Start Using Open MCT
-
1Clone the source code
-
2Install development Dependencies
-
3Run a local development server
Running and building Open MCT in your local dev environment is very easy. Be sure you have Git and Node.js installed, then follow the directions on the left. Need additional information? Check out our Getting Started page.
See Open MCT in Action
This is a demonstration of Open MCT showing some of its major features. This demo shows the basic concepts behind Open MCT including objects and their role within composition. It demonstrates the capability of Open MCT to view telemetry data in different ways, within the same application.
Also demonstrated is the ability to compose and modify screen layouts, bringing together various telemetry objects and other object types in a single screen.


