Block to Block Connectivity
Computational Grids are often divided into blocks for easier gridding. It is important to know how these blocks connect with each other in order to model the transfer of information. Computational Fluid Dynamics (CFD) requires the solver to know the “connectivity” of these blocks.
The plot3D python library has a function for determining the connectivity. This is found by taking the combination of each block with another block and scanning the nodes on the exterior faces of block 1 with the exterior face of block 2. If there is a match then the two faces are connected. The code can search for full face matches or partial matching. Full face matching is much faster and should be used if your grid has a definite match.
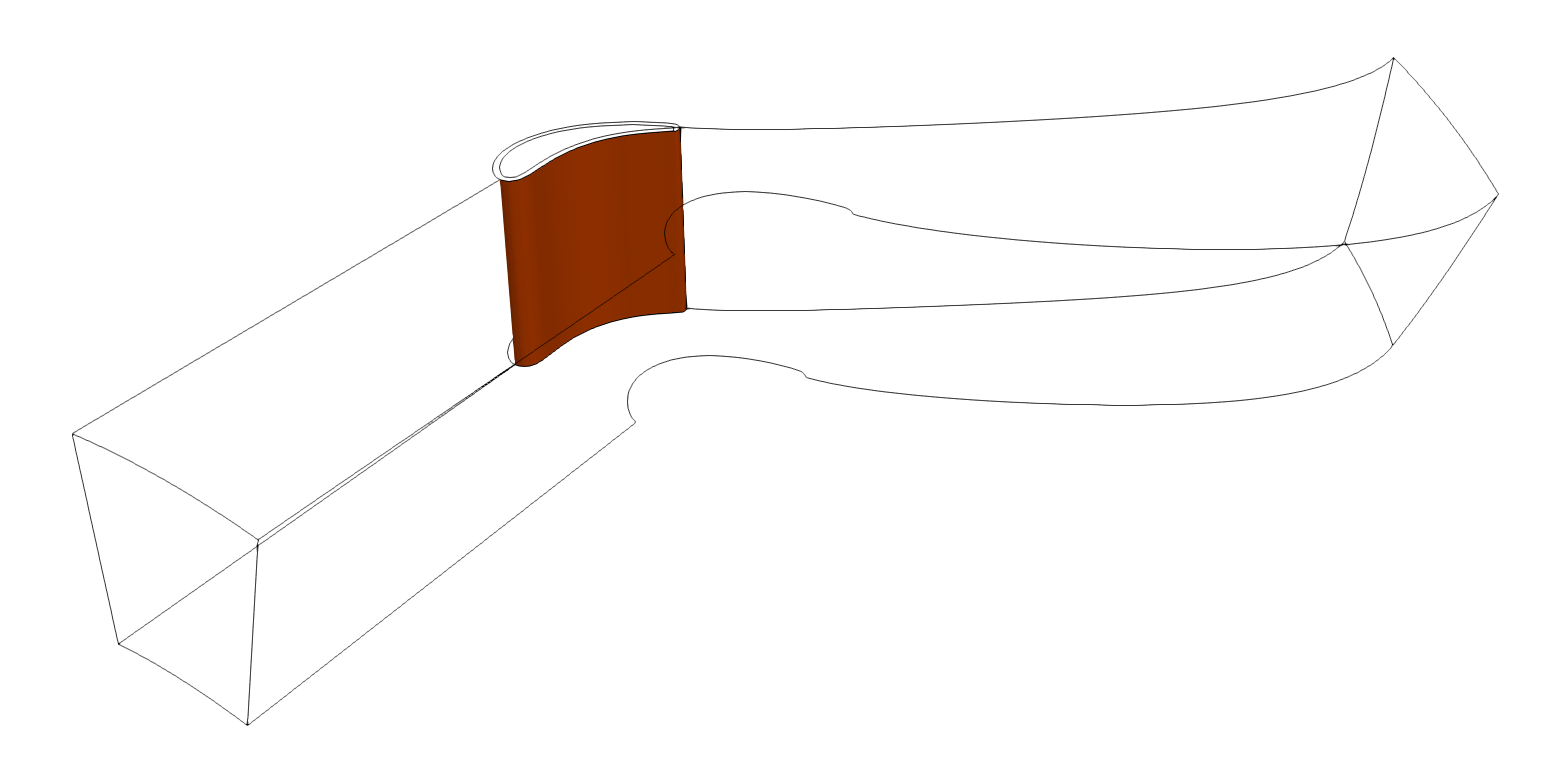
Below is an example of a turbine domain with two blocks: HGrid in (red) and ogrid in (white). The two share a connected face with partial matching. There’s also the o-mesh which within itself has a connected face.
To find connectivity simply call the function connectivity and pass in the blocks. This will return two things: face_matches and outer faces. Face matches are faces that are connected between the blocks. Outer faces are the remaining outer faces that aren’t connected to anything. This can take a long time to run for larger meshes.
1blocks = read_plot3D('PahtCascade.xyz', binary = True, big_endian=True)
2# Block 1 is the blade O-Mesh k=0
3# outer_faces, _ = get_outer_faces(blocks[0]) # lets check
4face_matches, outer_faces_formatted = connectivity(blocks)
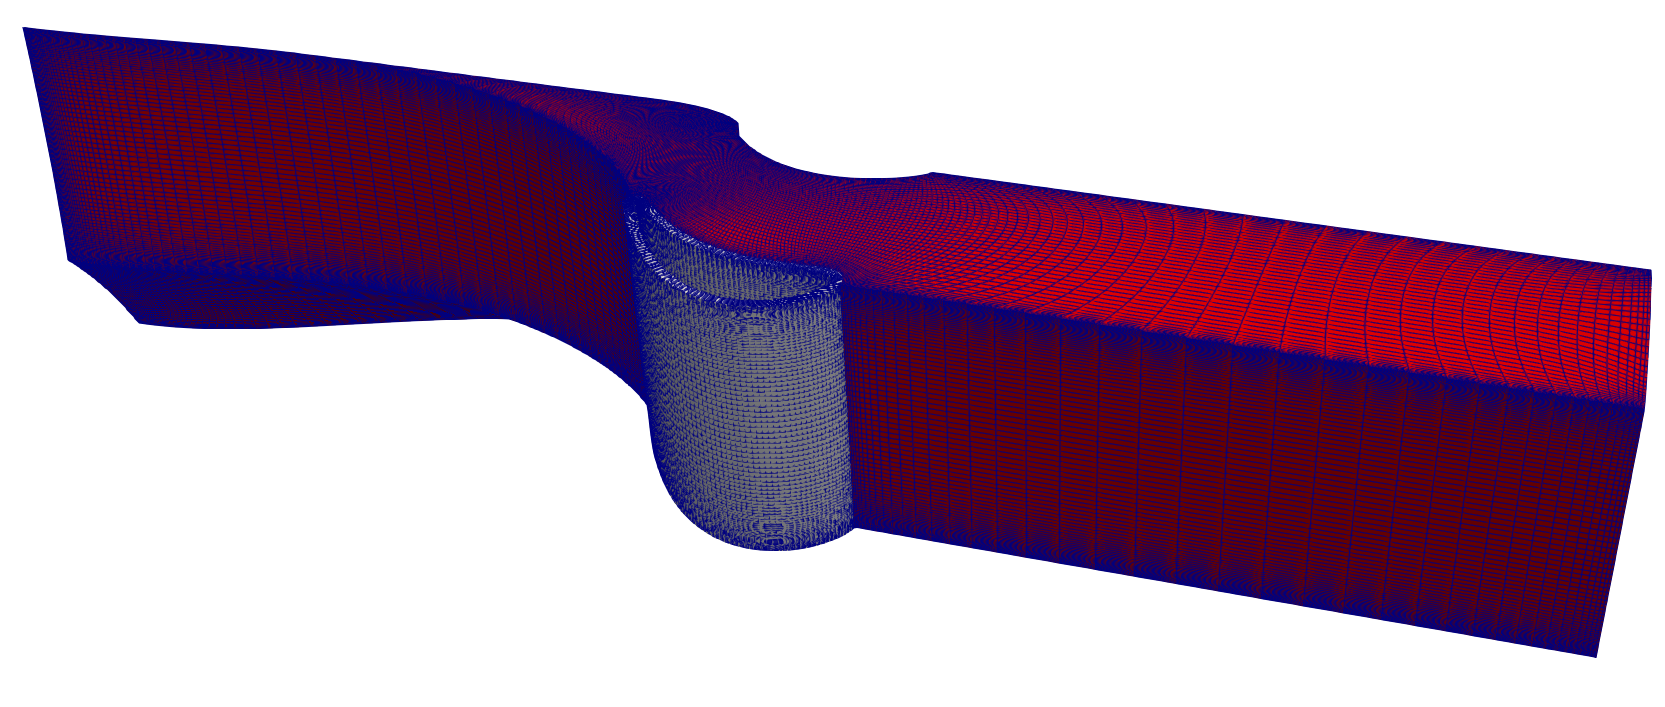
This is an example of the output. The figure below shows the block 1 and 2 matching faces found in the variable face_matches.
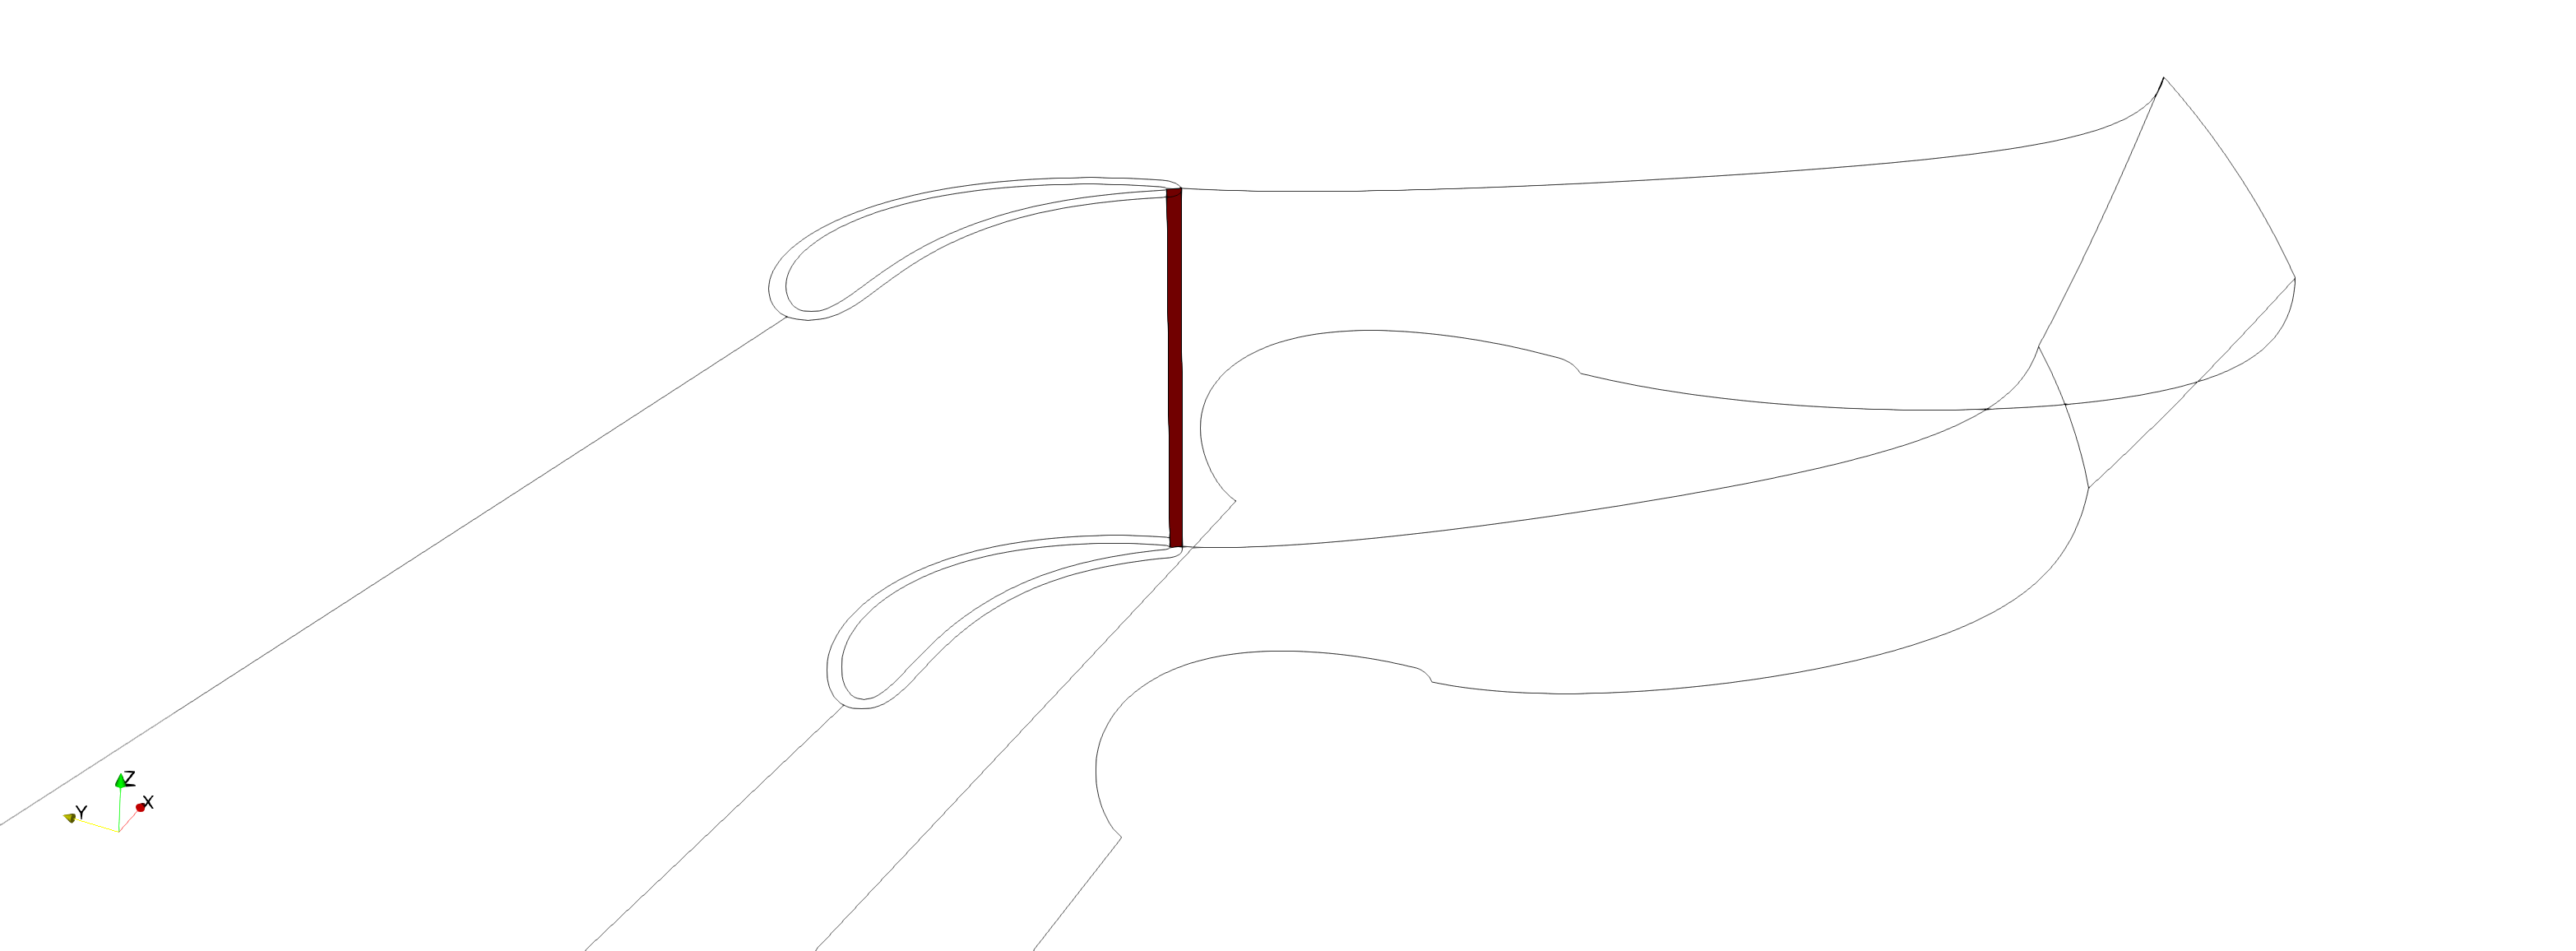
This is the matching face within the omesh
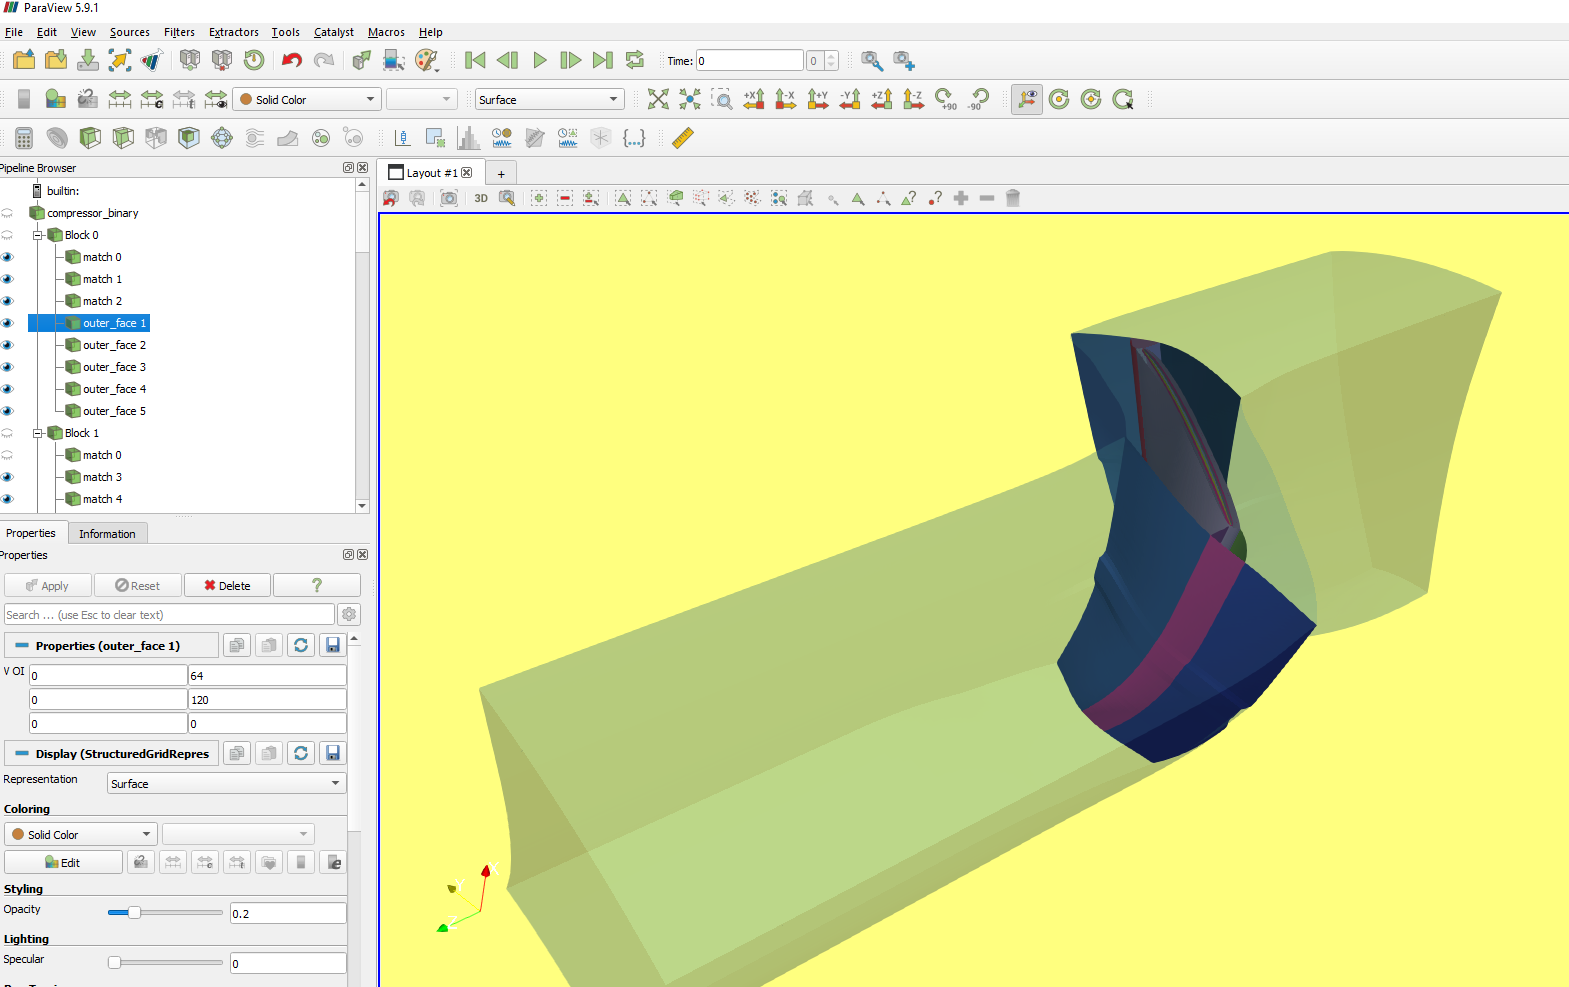
Plotting Connectivity using Paraview
This example shows how you can take a mesh created Numeca Autogrid and plot the connecitivity using paraview. With this information, anyone should be able to comprehend the format and export it to whatever solver. This code has been tested using paraview 5.9. Modifications may need to be added for Paraview 5.10
Note
Important Note: This is a 2 step process because: Paraview has it’s own python environment called pvpython which it uses to automate plotting. You do not have full access to this library, so pip installs won’t work. This means you cannot directly call the plot3d library from paraview.
We need to split this into 2 codes.
Part 1 One code runs on python from your own environment.
Part 2 the other code runs from paraview’s python environment.
Part 1 - Processing the data locally for paraview import
The goal if this code is to create a pickle file that is read in part 2. This pickle file contains the matching faces and outer faces.
from itertools import combinations
import os, sys
sys.path.insert(0,'../../')
sys.path.insert(1,"../Cascade")
from plot3d import write_plot3D, read_plot3D, find_periodicity
from plot3d import find_matching_blocks, get_outer_faces, connectivity
from glennht_con import export_to_glennht_conn
import pickle

# Convert to binary because of size
if not os.path.exists('connectivity.pickle'):
    blocks = read_plot3D('[Path to your Plot3D File]', binary = False) # Paraview has issues with ASCII
    write_plot3D('[Path to your Plot3D File]',blocks, binary = True)   # Converted to binary for easy reading

    # Block 1 is the blade O-Mesh k=0
    face_matches, outer_faces_formatted = connectivity(blocks)
    with open('connectivity.pickle','wb') as f:
        pickle.dump({"face_matches":face_matches, "outer_faces":outer_faces_formatted},f)
Part 2 - Calling Paraview in script mode
This part of the code shows how you can read the pickle file in part 1 from within paraview to display all your plots.
This code was tested with Paraview version 5.9 https://www.paraview.org/download/
Paraview executable can be called with the script option to have it automatically create the plots for you.
For windows this looks like this. You have the [working folder]>”[path to paraview executable]” –script=[your_python_script.py]
Note
Has been tested on Paraview 5.10. Not backwards compatible with older paraview versions
C:\Github\Plot3D_utilities\python\test\paraview_plot > “C:\Program Files\ParaView 5.10.0-Windows-Python3.9-msvc2017-AMD64\bin\paraview.exe” –script=compressor_plot_test.py

import sys
import os
import pickle
from typing import List
sys.path.insert(0,os.getcwd()) # This allows you to select files locally
from pv_library import Load, ExtractBlocks, ExtractSurface
from paraview.simple import *
import random


def CreateSubset(block_source,voi:List[int],name:str,opacity:float=1):
    """Creates a subset within paraview to display the mesh

    Args:
        block_source ([type]): [description]
        voi (List[int]): This is the volume of interest. When (I,J,K)MIN=(I,J,K)MAX it is a surface/face. When two quantities is the same e.g. IMIN=IMAX and JMIN=JMAX you have an edge. If none of them are equal then you have a volume
        name (str): Name you want paraview to display in the left
        opacity (float, optional): [description]. Defaults to 1.

    Returns:
        (tuple): tuple containing:

            - **extractSubset1** (paraview source): source object representing the subset.
            - **extractSubset1Display** (paraview display): display settings for the source.
    """
    # Plot the Face
    Hide(block_source, View)
    extractSubset1 = ExtractSubset(registrationName=name, Input=block_source)
    extractSubset1.VOI = voi

    renderView1 = GetActiveViewOrCreate('RenderView')
    extractSubset1Display = Show(extractSubset1, renderView1, 'StructuredGridRepresentation')
    # trace defaults for the display properties.
    extractSubset1Display.Representation = 'Surface'
    extractSubset1Display.ColorArrayName = [None, '']
    extractSubset1Display.SelectTCoordArray = 'None'
    extractSubset1Display.SelectNormalArray = 'None'
    extractSubset1Display.SelectTangentArray = 'None'
    extractSubset1Display.OSPRayScaleFunction = 'PiecewiseFunction'
    extractSubset1Display.SelectOrientationVectors = 'None'
    extractSubset1Display.ScaleFactor = 7.410221099853516
    extractSubset1Display.SelectScaleArray = 'None'
    extractSubset1Display.GlyphType = 'Arrow'
    extractSubset1Display.GlyphTableIndexArray = 'None'
    extractSubset1Display.GaussianRadius = 0.3705110549926758
    extractSubset1Display.SetScaleArray = [None, '']
    extractSubset1Display.ScaleTransferFunction = 'PiecewiseFunction'
    extractSubset1Display.OpacityArray = [None, '']
    extractSubset1Display.OpacityTransferFunction = 'PiecewiseFunction'
    extractSubset1Display.DataAxesGrid = 'GridAxesRepresentation'
    extractSubset1Display.PolarAxes = 'PolarAxesRepresentation'
    extractSubset1Display.ScalarOpacityUnitDistance = 6.758095838007181
    extractSubset1Display.SetRepresentationType('Surface')
    extractSubset1Display.Opacity = opacity
    # Add in the face color and update
    extractSubset1Display.AmbientColor = rgb_face_matches[match_indx]
    extractSubset1Display.DiffuseColor = rgb_face_matches[match_indx]
    renderView1.Update()

    return extractSubset1, extractSubset1Display

'''
Main Code
'''

if __name__=="__main__":
    '''
    Read the connectivity file
    '''
    with open('connectivity.pickle','rb') as f:
        data = pickle.load(f)
        face_matches = data['face_matches']
        outer_faces = data['outer_faces']
        if 'periodic_surfaces' in data:
            periodic_faces = data['periodic_surfaces']
        else:
            periodic_faces = []

    blocks_to_extract = [f['block1']['block_index'] for f in face_matches]
    blocks_to_extract.extend([f['block2']['block_index'] for f in face_matches])
    blocks_to_extract = list(set(blocks_to_extract))

    '''
    Generate Random Colors

    This part generates random colors so that each color is associated with a face match.
    Doesn't matter what the block is a single match is assigned the same color.
    '''
    rgb_face_matches = list()
    for i in range(len(face_matches)):
        rgb_face_matches.append([random.randint(0,255)/255, random.randint(0,255)/255, random.randint(0,255)/255])

    rgb_outer_faces = list()
    for i in range(len(outer_faces)):
        rgb_outer_faces.append([random.randint(0,255)/255, random.randint(0,255)/255, random.randint(0,255)/255])

    # Load mesh
    plot3d_binary_filename = 'R4_testfile_binary.xyz'
    plot3D_source,plot3D_Display,View,LUT = Load(plot3d_binary_filename)
    surface_indx = 1

    '''
    Loop through all the blocks and create within each block the match and the outer surfaces
    '''
    for b in blocks_to_extract: # Block indicies
        block_source,block_display,LUT = ExtractBlocks(plot3D_source,View,[b])
        RenameSource('Block '+str(b), block_source)
        block_source = FindSource('Block '+str(b))

        # Plot the face matches
        for match_indx, f in enumerate(face_matches):
            # Add Plots for Matched Faces
            if f['block1']['block_index'] == b or f['block2']['block_index'] == b :
                if f['block1']['block_index'] == b:
                    voi = [f['block1']['IMIN'], f['block1']['IMAX'], f['block1']['JMIN'], f['block1']['JMAX'],f['block1']['KMIN'], f['block1']['KMAX']]
                else:
                    voi = [f['block2']['IMIN'], f['block2']['IMAX'], f['block2']['JMIN'], f['block2']['JMAX'],f['block2']['KMIN'], f['block2']['KMAX']]
                CreateSubset(block_source, voi, name='match '+str(match_indx))

        # Plot the outer faces
        for o in outer_faces:
            # Add Plots for Outer Faces
            if o['block_index'] == b:
                    voi = [o['IMIN'], o['IMAX'], o['JMIN'], o['JMAX'],o['KMIN'], o['KMAX']]
                    CreateSubset(block_source, voi, name='outer_face '+str(surface_indx),opacity=0.2)
                    surface_indx +=1

        for periodic_indx, p in enumerate(periodic_faces):
            # Add Plots for Outer Faces
            if p['block1']['block_index'] == b and p['block2']['block_index'] == b: # Periodicity within the block
                voi = [p['block1']['IMIN'], p['block1']['IMAX'], p['block1']['JMIN'], p['block1']['JMAX'],p['block1']['KMIN'], p['block1']['KMAX']]
                CreateSubset(block_source, voi, name='periodic '+str(periodic_indx))
                voi = [p['block2']['IMIN'], p['block2']['IMAX'], p['block2']['JMIN'], p['block2']['JMAX'],p['block2']['KMIN'], p['block2']['KMAX']]
                CreateSubset(block_source, voi, name='periodic '+str(periodic_indx))

            elif p['block1']['block_index'] == b or p['block2']['block_index'] == b: # Periodicity from block to block
                if p['block1']['block_index'] == b:
                    voi = [p['block1']['IMIN'], p['block1']['IMAX'], p['block1']['JMIN'], p['block1']['JMAX'],p['block1']['KMIN'], p['block1']['KMAX']]
                else:
                    voi = [p['block2']['IMIN'], p['block2']['IMAX'], p['block2']['JMIN'], p['block2']['JMAX'],p['block2']['KMIN'], p['block2']['KMAX']]
                CreateSubset(block_source, voi, name='periodic '+str(periodic_indx))
This is the contents of pv_library.py
from typing import List
from paraview.simple import *
import os
import math
#pylint: skip-file
paraview.simple._DisableFirstRenderCameraReset()

def Load(filename:str):
    """Calls pvpython and displays the file

    Args:
        filename (str): [description]

    Returns:
        (tuple): tuple containing:

            - **Plot3D** (paraview.source): source object for plot3d
            - **plot3D_Display** (paraview display): this is the display object for the source. Colors and things
            - **View** (paraview.source): source object for plot3d

    """
    plot3D = PLOT3DReader(registrationName=filename,
            QFileName='',
            FileName=filename,
            FunctionFileName='')

    # set active source
    SetActiveSource(plot3D)
    # get active view
    View = GetActiveViewOrCreate('RenderView')
    # show data in view
    plot3D_Display = Show(plot3D, View)
    # trace defaults for the display properties.
    plot3D_Display.Representation = 'Outline'
    plot3D_Display.ColorArrayName = ['POINTS', '']
    plot3D_Display.OSPRayScaleFunction = 'PiecewiseFunction'
    plot3D_Display.SelectOrientationVectors = 'None'
    plot3D_Display.ScaleFactor = 0.5376288175582886
    plot3D_Display.SelectScaleArray = 'None'
    plot3D_Display.GlyphType = 'Arrow'
    plot3D_Display.PolarAxes = 'PolarAxesRepresentation'
    plot3D_Display.ScalarOpacityUnitDistance = 0.11673090489063437

    # reset view to fit data
    View.ResetCamera()

    # show color bar/color legend
    plot3D_Display.SetRepresentationType('Outline')
    ColorBy(plot3D_Display, ('FIELD', 'vtkBlockColors'))
    LUT = GetColorTransferFunction('SolidColor')
    HideScalarBarIfNotNeeded(LUT, View) # Change to solid color
    return plot3D,plot3D_Display,View,LUT

def SetCamera(View,position,focalPoint,ViewUp):
    # current camera placement for renderView1
    View.CameraPosition = position
    View.CameraFocalPoint = focalPoint
    View.CameraViewUp = ViewUp
    View.CameraParallelScale = 3.242501630387953

# Extracts the mesh block
# Block indicies should be an array format
def ExtractBlocks(source,View,BlockIndicies):
    extractBlock1 = ExtractBlock(Input=source)
    extractBlock1.Selectors = [f"/Root/Block{i}" for i in BlockIndicies]
    extractBlock1Display = Show(extractBlock1, View)
    extractBlock1Display.Representation = 'Outline'
    extractBlock1Display.ColorArrayName = ['POINTS', '']
    extractBlock1Display.OSPRayScaleFunction = 'PiecewiseFunction'
    extractBlock1Display.SelectOrientationVectors = 'None'
    extractBlock1Display.ScaleFactor = 0.2489664673805237
    extractBlock1Display.SelectScaleArray = 'None'
    extractBlock1Display.GlyphType = 'Arrow'
    extractBlock1Display.PolarAxes = 'PolarAxesRepresentation'
    extractBlock1Display.ScalarOpacityUnitDistance = 0.07851226208722488
    Hide(source, View)
    SetActiveSource(extractBlock1)
    # set scalar coloring
    ColorBy(extractBlock1Display, ('FIELD', 'vtkBlockColors'))

    # show color bar/color legend
    extractBlock1Display.SetScalarBarVisibility(View, True)

    # show color bar/color legend
    ColorBy(extractBlock1Display, ('FIELD', 'vtkBlockColors'))
    LUT = GetColorTransferFunction('vtkBlockColors')
    extractBlock1Display.SetRepresentationType('Surface With Edges')
    ColorBy(extractBlock1Display, ('FIELD', 'Solid Color'))
    HideScalarBarIfNotNeeded(LUT, View) # Change to solid color
    return extractBlock1,extractBlock1Display,LUT

def ExtractSurface(source,name:str,VOI:List[int]):
    """[summary]

    Args:
        source ([type]): [description]
        name (string): name of surface
        VOI (List[int]): Volume of interest [imin,imax,jmin,jmax,kmin,kmax]
    Returns:
        [type]: [description]
    """
    renderView1 = GetActiveViewOrCreate('RenderView')

    Hide(source, renderView1)
    extractSubset1 = ExtractSubset(registrationName=name, Input=source)
    extractSubset1.VOI = voi

    renderView1 = GetActiveViewOrCreate('RenderView')
    extractSubset1Display = Show(extractSubset1, renderView1, 'StructuredGridRepresentation')
    # trace defaults for the display properties.
    extractSubset1Display.Representation = 'Outline'
    extractSubset1Display.ColorArrayName = [None, '']
    extractSubset1Display.SelectTCoordArray = 'None'
    extractSubset1Display.SelectNormalArray = 'None'
    extractSubset1Display.SelectTangentArray = 'None'
    extractSubset1Display.OSPRayScaleFunction = 'PiecewiseFunction'
    extractSubset1Display.SelectOrientationVectors = 'None'
    extractSubset1Display.ScaleFactor = 7.410221099853516
    extractSubset1Display.SelectScaleArray = 'None'
    extractSubset1Display.GlyphType = 'Arrow'
    extractSubset1Display.GlyphTableIndexArray = 'None'
    extractSubset1Display.GaussianRadius = 0.3705110549926758
    extractSubset1Display.SetScaleArray = [None, '']
    extractSubset1Display.ScaleTransferFunction = 'PiecewiseFunction'
    extractSubset1Display.OpacityArray = [None, '']
    extractSubset1Display.OpacityTransferFunction = 'PiecewiseFunction'
    extractSubset1Display.DataAxesGrid = 'GridAxesRepresentation'
    extractSubset1Display.PolarAxes = 'PolarAxesRepresentation'
    extractSubset1Display.ScalarOpacityUnitDistance = 6.758095838007181

    # update the view to ensure updated data information
    renderView1.Update()

    extractSubset1Display.SetRepresentationType('Outline')

    return extractSubset1,extractSubset1Display

def ChangeRepresentationMesh(source,sourceDisplay,View,LUT):
    SetActiveSource(source) # set active source
    HideScalarBarIfNotNeeded(LUT, View) # Hide the scalar bar for this color map if no visible data is colored by it.
    sourceDisplay.SetRepresentationType('Surface With Edges') # set active source
    ColorBy(sourceDisplay, ('FIELD', 'Solid Color'))


def Periodicity(source,nBlades,BlockIndices,View):
    # hide data in view
    Hide(source, View)
    angularPeriodicFilter1 = AngularPeriodicFilter(Input=source)

    # Properties modified on angularPeriodicFilter1
    angularPeriodicFilter1.BlockIndices = BlockIndices
    angularPeriodicFilter1.IterationMode = 'Manual'
    angularPeriodicFilter1.NumberOfPeriods = 2
    angularPeriodicFilter1.RotationAngle = 360.0/nBlades

    SetActiveSource(angularPeriodicFilter1)
    # get color transfer function/color map for 'Density'
    LUT = GetColorTransferFunction('Density')

    # show data in view
    angularPeriodicFilter1Display = Show(angularPeriodicFilter1, View)
    # trace defaults for the display properties.
    angularPeriodicFilter1Display.Representation = 'Outline'
    angularPeriodicFilter1Display.ColorArrayName = ['POINTS', 'Density']
    angularPeriodicFilter1Display.LookupTable = LUT
    angularPeriodicFilter1Display.OSPRayScaleArray = 'Density'
    angularPeriodicFilter1Display.OSPRayScaleFunction = 'PiecewiseFunction'
    angularPeriodicFilter1Display.SelectOrientationVectors = 'Momentum'
    angularPeriodicFilter1Display.ScaleFactor = 0.6140377521514893
    angularPeriodicFilter1Display.SelectScaleArray = 'Density'
    angularPeriodicFilter1Display.GlyphType = 'Arrow'
    angularPeriodicFilter1Display.PolarAxes = 'PolarAxesRepresentation'
    angularPeriodicFilter1Display.ScalarOpacityUnitDistance = 0.35345957752629076
    # show color bar/color legend
    angularPeriodicFilter1Display.SetScalarBarVisibility(View, True)
    return angularPeriodicFilter1,angularPeriodicFilter1Display,LUT


def CreateNewLayout(source,layoutName):
    CreateLayout(layoutName)

    # Create a new 'Render View'
    renderView2 = CreateView('RenderView')
    #renderView2.ViewSize = [1233, 814]
    renderView2.AxesGrid = 'GridAxes3DActor'
    renderView2.StereoType = 0
    renderView2.Background = [0.32, 0.34, 0.43]
    layout = GetLayout()

    # set active source
    if (source):
        SetActiveSource(source)
        # show data in view
        sourceDisplay = Show(source, renderView2)
        # trace defaults for the display properties.
        sourceDisplay.Representation = 'Outline'
        sourceDisplay.ColorArrayName = ['POINTS', '']
        sourceDisplay.OSPRayScaleArray = 'Density'
        sourceDisplay.OSPRayScaleFunction = 'PiecewiseFunction'
        sourceDisplay.SelectOrientationVectors = 'Momentum'
        sourceDisplay.ScaleFactor = 0.5376288175582886
        sourceDisplay.SelectScaleArray = 'Density'
        sourceDisplay.GlyphType = 'Arrow'
        sourceDisplay.PolarAxes = 'PolarAxesRepresentation'
        sourceDisplay.ScalarOpacityUnitDistance = 0.11673090489063437
        # reset view to fit data
        renderView2.ResetCamera()
        return layout,sourceDisplay,renderView2

    return layout,renderView2
The output should look like the following